
Progressive Delivery at Scale: Argo Rollouts, Automated Canary Analysis & Multi-Cluster Blue/Green Deployments
Daily DevOps Mentor — 2026-09-03
1. Topic of the Day
A standard Kubernetes Deployment rolling update is a blunt instrument: it shifts traffic to new pods based on readiness probes passing, not on whether the new code is actually behaving correctly under real traffic. A pod can pass a liveness/readiness check and still return elevated 5xx rates, leak connections, or silently corrupt a downstream cache — and the rolling update will happily keep scaling it up because "ready" and "correct" are different things. By the time a human notices the error-rate dashboard, the bad version is already serving 60-100% of traffic.
Progressive delivery closes that gap by making traffic shift a function of observed behavior, not just pod readiness. Argo Rollouts is the CNCF-adjacent (Argo Project, part of the Argo suite alongside Argo CD, Argo Workflows, Argo Events) controller that implements this as a Kubernetes-native CRD: it replaces Deployment with a Rollout resource that drives canary or blue/green strategies, integrates with a traffic-management layer (Gateway API, Istio, NGINX, ALB, SMI) to do weighted splits, and — critically — pauses at each step to run an AnalysisRun against Prometheus, Datadog, CloudWatch, or a webhook, auto-promoting on success and auto-aborting with rollback on failure.
This matters more at scale, not less. A team doing five deploys a week can get away with a human watching a dashboard for ten minutes post-deploy. A platform running 200+ services with multiple daily deploys per service cannot staff that many human canary-watchers, and manual promote/rollback decisions become the throughput ceiling on the whole delivery pipeline. Progressive delivery is what lets deployment frequency scale without a linear increase in incident risk — it's the same reason Netflix, Google, and Meta all built (or adopted) automated canary analysis systems rather than staffing more release engineers.
As of Argo Rollouts v1.10.0 (released 2026-08-05, following v1.9's GA milestone announced at ArgoCon North America), the project has matured well past "canary via NGINX annotations" into a general traffic-shifting control plane: native Gateway API support (HTTPRoute weight manipulation, no vendor-specific ingress annotations required), plugin-based traffic routers for Istio, SMI, Ambassador, Apache APISIX, and cloud load balancers, experiment-based A/B testing, and — the piece most platform teams underuse — AnalysisTemplate composition that lets a shared library of metric queries (error rate, latency SLO burn, business KPIs) be reused across every service's rollout instead of hand-rolled per-team dashboards nobody trusts.
Today's session covers designing a production canary pipeline end to end: the controller's reconciliation model, how to write AnalysisTemplate queries that actually catch regressions instead of just checking "pod is up," multi-cluster blue/green for regional failover, and where progressive delivery breaks down at higher scale (spoiler: analysis query cardinality and canary baseline selection are the two things that bite hardest).
2. Real Business Problem
Symptom: A payments platform team ships a Deployment-based rolling update to their checkout service — 40 pods, maxSurge: 25%, maxUnavailable: 0. The new version introduces a subtle regression: a serialization change that corrupts roughly 3% of a specific currency-conversion code path. Readiness probes are a simple /healthz that only checks DB connectivity, so every new pod passes immediately.
- Kubernetes scales up new pods and scales down old ones over ~6 minutes per standard rolling-update pacing. By minute 4, 100% of pods are running the new version.
- The 3% error rate on that one code path doesn't trip any existing alert — the overall error rate for the service barely moves (3% of a low-traffic currency path is noise against total request volume), and the on-call engineer's Grafana dashboard shows a normal-looking deploy.
- Four hours later, the finance reconciliation job flags a mismatch. Root-causing takes another two hours because the deploy that caused it doesn't stand out in any monitoring view — it's buried in a sea of routine deploys from that day.
- Total blast radius: ~11,000 transactions affected before a full rollback, each requiring manual reconciliation. Post-incident review estimates the fix-forward cost at several engineer-weeks plus a customer-trust hit serious enough for an executive-level incident review.
The ask, verbatim from the VP of Engineering after the retro: "We need every deploy on payment-critical services to prove itself against real production traffic on a shrinking blast radius, automatically, before it's allowed to reach 100% — and it needs to roll itself back before a human even gets paged, not after." That is exactly the brief progressive delivery answers: instead of "did the pods become Ready," the promotion gate becomes "does canary traffic show statistically indistinguishable (or better) behavior vs. the stable baseline, measured directly against the business-relevant metrics" — and the whole loop, from 5% canary to full promotion or automatic abort, needs to run without a human in the loop for the common case, with humans only pulled in for the exceptions.
3. Production Architecture
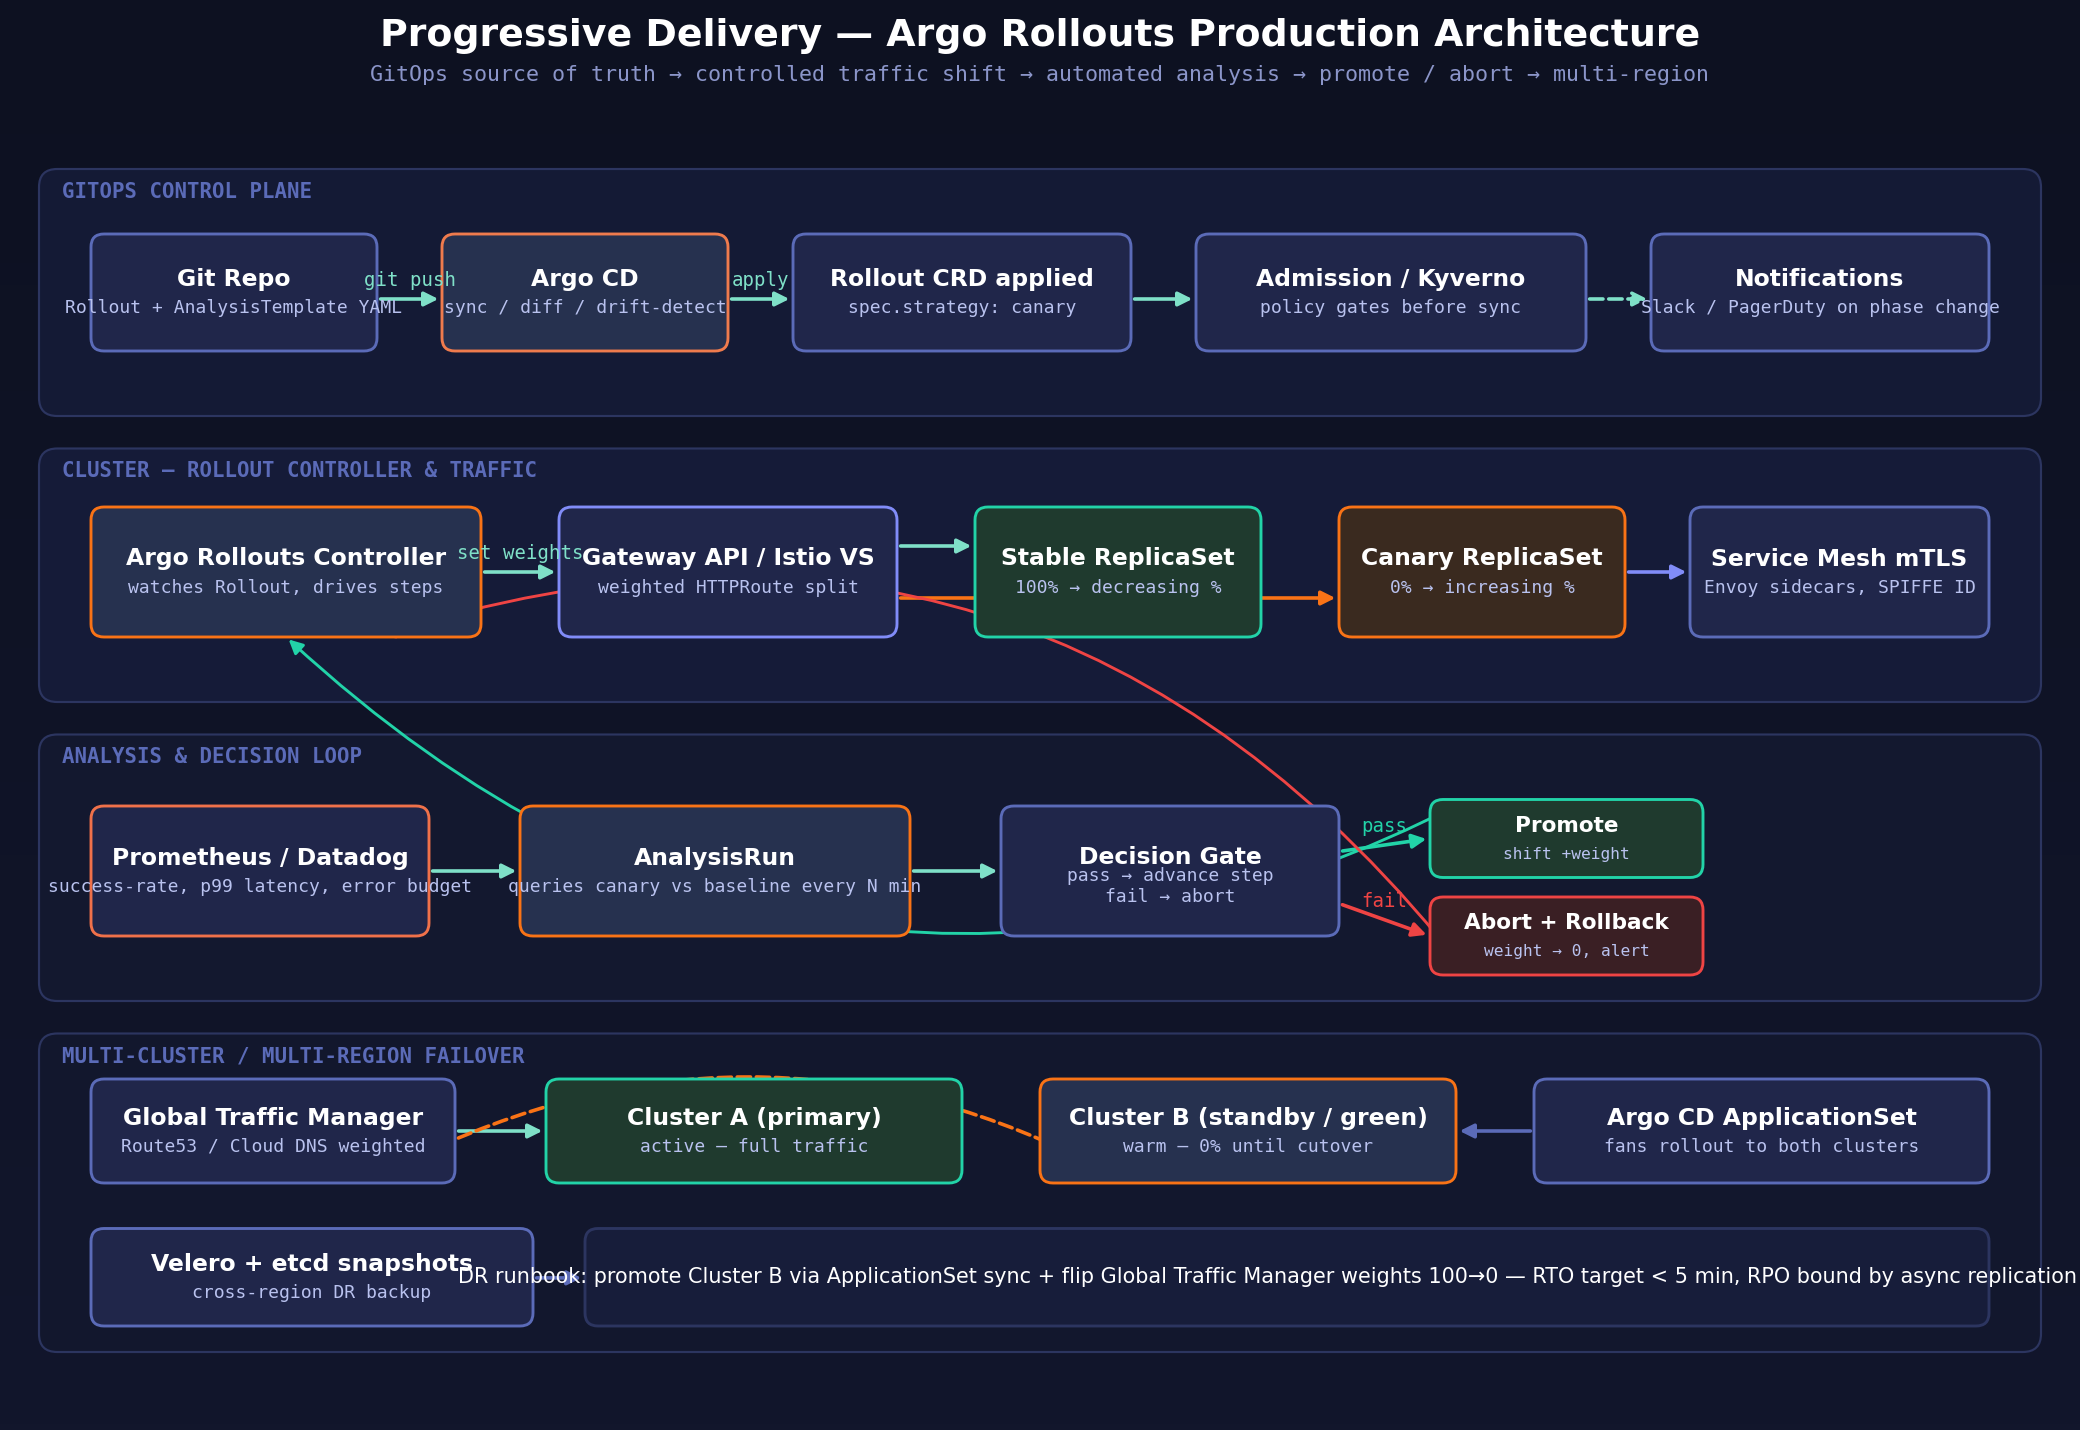
GitOps control plane. The Rollout and AnalysisTemplate manifests live in Git as the single source of truth, alongside every other workload spec. Argo CD syncs them into the cluster the same way it syncs any other resource — progressive delivery doesn't replace GitOps, it composes with it. This matters operationally: a rollback at the GitOps layer (revert the commit, Argo CD re-syncs) and a rollback at the Rollout layer (AnalysisRun fails, controller aborts and scales canary to zero) are two different, complementary safety nets operating at different timescales — Git revert for "we shipped the wrong config," Rollout abort for "the code is fine syntactically but behaves badly under real traffic." An admission layer (Kyverno or OPA Gatekeeper) sits in front of sync to enforce policy — e.g., every Rollout touching a namespace tagged tier=critical must reference an AnalysisTemplate, or CI is blocked from bypassing the strategy with a raw kubectl scale.
Controller and traffic layer. The Argo Rollouts controller runs as a standard Kubernetes controller (leader-elected, HA across 2-3 replicas), watching Rollout objects and driving a state machine through the declared steps. It never talks to traffic infrastructure directly in a vendor-specific way — instead it delegates to a traffic router plugin: the built-in Gateway API integration patches HTTPRoute backendRefs weights, the Istio plugin patches VirtualService weight splits (or, since Istio's ambient mode adoption accelerated through 2026, works against HTTPRoute-based Gateway API config for mesh traffic instead of legacy VirtualService where teams have migrated), and cloud-LB plugins (AWS ALB, GCP), NGINX, and SMI plugins exist for teams not yet on Gateway API. This abstraction is the single most important design decision in the project: it means canary logic — steps, pauses, analysis — is portable across whatever L7 traffic layer a platform team standardizes on, and a mesh migration (like the ambient-mesh migration covered in a recent session) doesn't require rewriting every team's rollout strategy.
Analysis and decision loop. At each setWeight step, the controller creates an AnalysisRun from the referenced AnalysisTemplate, which executes one or more metric providers — Prometheus range queries are the overwhelming majority case in production, but Datadog, CloudWatch, New Relic, Wavefront, and generic webhook providers are all supported for teams whose SLO tooling lives elsewhere. Each query returns a value that's compared against successCondition / failureCondition expressions. The controller polls on an interval, accumulates count measurements, and only advances the rollout once the analysis reports Successful — or immediately halts and (depending on abortScaleDownDelaySeconds config) rolls back on Failed, Error, or Inconclusive beyond a configured threshold.
Multi-cluster / multi-region. For services with regional failover requirements, an ApplicationSet (Argo CD's multi-cluster generator) fans the same Rollout manifest out to a primary and standby cluster. Blue/green at the cluster level, not just the pod level: Cluster A serves 100% of traffic while Cluster B runs the new version warm at 0% via a global traffic manager (Route 53 weighted routing, Cloud DNS, or a global load balancer). Regional cutover becomes a DNS/traffic-manager weight flip rather than a full redeploy, and it composes with the same analysis-gated promotion model — the global cutover only proceeds after in-cluster canary analysis on Cluster B has already passed, so a regional failover never promotes untested code.
Why this shape, and the trade-off. The alternative — building canary logic into CI/CD scripts that manually adjust replica counts and poll Prometheus with curl — is what most teams do before they hit this pain, and it works until it doesn't: the logic is duplicated per service, drifts, and has no standard abort semantics. Centralizing it in a controller means every service gets the same tested state machine, but it also means the controller becomes a piece of critical-path infrastructure — its own HA, upgrade path, and blast radius (a controller bug affecting analysis logic affects every rollout cluster-wide) now matter as much as the traffic router's.
4. Solution Design
Strategy choice: canary vs. blue/green. Canary (progressive traffic-percentage shifting) suits stateless, horizontally-scaled services where partial exposure is safe and rollback cost is low — most HTTP APIs. Blue/green (instant full cutover between two complete environments) suits cases where partial exposure is unsafe — schema-sensitive batch consumers, anything where two versions running simultaneously against shared state causes corruption, or where the org's risk tolerance demands "either 0% or 100%, nothing in between, with instant rollback." Argo Rollouts supports both natively; the choice is a data-consistency and blast-radius question, not a tooling limitation.
Alternative approaches considered and rejected:
- Flagger (Weaveworks-originated, now CNCF, in the Flux ecosystem) does essentially the same job for teams standardized on Flux instead of Argo CD. Choosing between them is almost entirely "which GitOps controller do you already run" — Flagger for Flux shops, Argo Rollouts for Argo CD shops. Running Flagger alongside Argo CD (or vice versa) doubles the operational surface for no benefit.
- Service-mesh-native traffic shaping with manual promotion (hand-written
VirtualServiceweight patches in a CI pipeline) was the team's prior approach. Rejected going forward because it has no standard abort semantics, no analysis integration, and every team reinvents slightly different (and slightly buggy) promotion logic. - Feature flags as the sole progressive-delivery mechanism (LaunchDarkly-style percentage rollout at the application layer) is complementary, not a substitute — it operates above the deployment layer and can't catch infrastructure-level regressions (bad resource limits, broken readiness behavior, node-affinity misconfiguration) that only manifest when new pods are running, not when a flag flips inside already-running pods. Mature platforms run both: infra-level canary via Rollouts, business-logic-level canary via flags, layered.
Scalability considerations. The controller reconciles every Rollout object independently; horizontal scale is bounded by API server watch/list load (same chokepoint discussed in a recent control-plane-latency session) and by AnalysisRun query volume against the metrics backend. At a few hundred concurrent rollouts, Prometheus query load from analysis becomes the practical bottleneck before the controller itself does — this is addressed in the troubleshooting section below.
Cost implications. Canary steps mean running two versions simultaneously for the duration of the analysis window — extra pod-hours during the rollout, plus keeping a standby cluster warm for blue/green multi-region adds a near-permanent second footprint. This is a deliberate cost/risk trade: the extra compute spend is cheap relative to the cost of the incident class it prevents (see Section 2's ~11,000-transaction blast radius), but it should be sized explicitly — e.g., cap max canary replica count rather than mirroring 1:1 with stable, since the canary only needs enough replicas to get statistically meaningful traffic, not full production capacity.
Security implications. AnalysisTemplates that call webhook providers or read Prometheus need scoped RBAC and, in multi-tenant clusters, AnalysisTemplate vs. ClusterAnalysisTemplate matters — a cluster-scoped template is available to every namespace, which is convenient for shared SLO libraries but means a compromised or misconfigured namespace could reference (though not modify) a shared analysis definition. The traffic router integration itself needs RBAC scoped to patch only HTTPRoute/VirtualService objects it owns, not cluster-wide networking objects.
Performance implications. Every additional canary step and analysis interval adds wall-clock time to the deploy pipeline — a five-step canary with 5-minute analysis intervals is a 25+ minute rollout, which is the right trade for a payments-tier service and overkill for an internal admin tool. Strategy tuning per service tier (fewer, faster steps for low-risk services; more, slower steps with tighter statistical thresholds for critical-tier services) is a first-class design decision, not an afterthought.
5. Deep Technical Walkthrough
The Rollout resource and reconciliation. A Rollout replaces a Deployment (same pod template, same selector semantics) but adds a strategy.canary or strategy.blueGreen block:
apiVersion: argoproj.io/v1alpha1
kind: Rollout
metadata:
  name: checkout-service
spec:
  replicas: 40
  strategy:
    canary:
      canaryService: checkout-canary
      stableService: checkout-stable
      trafficRouting:
        gatewayAPI:
          httpRoute: checkout-route
          namespace: payments
      steps:
        - setWeight: 5
        - pause: { duration: 5m }
        - analysis:
            templates:
              - templateName: checkout-slo-analysis
            args:
              - name: canary-service
                value: checkout-canary
        - setWeight: 25
        - pause: { duration: 5m }
        - analysis:
            templates:
              - templateName: checkout-slo-analysis
        - setWeight: 60
        - pause: { duration: 10m }
        - analysis:
            templates:
              - templateName: checkout-slo-analysis
        - setWeight: 100
  selector:
    matchLabels: { app: checkout-service }
  template: { ... }
On each apply, the controller creates a new ReplicaSet for the updated pod spec (stable ReplicaSet stays at reduced-but-nonzero replica count matching 100 - currentWeight), patches the traffic router to the current step's weight, and either waits out a pause or spawns an AnalysisRun. The state machine is fully resumable — a controller restart mid-rollout picks up exactly where it left off by reading Rollout.status, which is why running the controller HA (leader election across replicas) matters: a single-replica controller crash during a live canary doesn't lose rollout state, but it does stall promotion until it comes back.
AnalysisTemplate — the part that actually catches regressions. This is where most implementations are either excellent or useless, and the difference is entirely in query design:
apiVersion: argoproj.io/v1alpha1
kind: AnalysisTemplate
metadata:
  name: checkout-slo-analysis
spec:
  args:
    - name: canary-service
  metrics:
    - name: error-rate-relative
      interval: 1m
      count: 5
      successCondition: result[0] <= 0.02
      failureLimit: 2
      provider:
        prometheus:
          address: http://prometheus.monitoring:9090
          query: |
            (
              sum(rate(http_requests_total{service="{{args.canary-service}}",code=~"5.."}[2m]))
              /
              sum(rate(http_requests_total{service="{{args.canary-service}}"}[2m]))
            )
            -
            (
              sum(rate(http_requests_total{service="checkout-stable",code=~"5.."}[2m]))
              /
              sum(rate(http_requests_total{service="checkout-stable"}[2m]))
            )
    - name: latency-p99-relative
      interval: 1m
      count: 5
      successCondition: result[0] <= 1.15
      provider:
        prometheus:
          query: |
            histogram_quantile(0.99, sum(rate(http_request_duration_seconds_bucket{service="{{args.canary-service}}"}[2m])) by (le))
            /
            histogram_quantile(0.99, sum(rate(http_request_duration_seconds_bucket{service="checkout-stable"}[2m])) by (le))
The critical design choice here is relative comparison against a live stable baseline, not an absolute threshold. An absolute error_rate <= 0.02 check fails to catch a regression during a traffic spike (stable is also degraded, so 2% might be good relative performance) and false-positives during quiet periods (0.5% might represent a real doubling of the baseline). Comparing canary directly against stable, measured over the same time window, controls for external factors — this is the same statistical principle behind Netflix's Kayenta/ACA (Automated Canary Analysis) system and Google's canary analysis tooling: never trust an absolute number, always trust a canary-vs-baseline delta measured concurrently.
Request flow during a canary step. Client request → Gateway API HTTPRoute (or Istio VirtualService) → weighted backend selection (5% probability routes to checkout-canary Service, 95% to checkout-stable) → Envoy/kube-proxy load-balances within the selected Service's endpoints → pod. The weighting happens at the L7 routing layer, before kube-proxy/Envoy load-balancing within a Service — this two-level split (router picks version, Service load-balancer picks replica) is why canary replica count doesn't need to match the weight percentage; three canary pods can validly receive 25% of traffic if the router is configured that way, independent of stable's 37 replicas.
Failure and recovery. If AnalysisRun reports Failed (an interval breached failureCondition, and failureLimit measurements have failed), the controller immediately sets canary weight to 0, marks the Rollout Degraded, and — depending on scaleDownDelaySeconds — either terminates canary pods immediately or keeps them briefly for log/debug access before GC. abort is distinct from a full rollback: the Rollout stays paused in a failed state pointing at the last-known-good stable version; a human (or an automated remediation controller) decides whether to retry the canary after a fix, or kubectl argo rollouts undo to fully revert the Rollout spec to the previous Git-committed version via Argo CD.
6. Production Troubleshooting
Symptom: canary stuck at a weight step, never promoting, no error surfaced.
kubectl argo rollouts get rollout checkout-service -n payments --watch— shows current step index and whether it'sPausedwaiting on duration, or waiting on anAnalysisRun.- If waiting on analysis:
kubectl get analysisrun -n payments -l rollout=checkout-service— checkstatus.phase.Runningwith no measurements yet often means the Prometheus query is malformed or timing out, not that the metric is bad. kubectl describe analysisrun <name> -n payments— thestatus.metricResults[].messagefield surfaces the actual Prometheus error (e.g.,query timeout, or aparse errorif a template argument didn't interpolate correctly — a very common bug is a metric label mismatch between what the app actually emits and what the query assumes, especially after a service-name refactor).- Direct-query Prometheus with the exact rendered query (substitute the template args by hand) to rule out a query-logic bug vs. a controller-integration bug.
Symptom: AnalysisRun flapping between pass/fail on a service with genuinely low traffic.
This is a statistical power problem, not a code problem: at low request volume, a 2% error-rate threshold can be tripped by two or three failed requests out of a hundred, pure noise. Root cause: interval/count tuned for a high-traffic service, copy-pasted into an AnalysisTemplate for a low-traffic one. Fix: either widen the analysis window (interval: 5m instead of 1m), require a minimum sample size (successCondition gated on count(...) > N inside the PromQL, not just the rate), or move low-traffic services to a longer soak-only canary without tight statistical gating — automated analysis has a traffic-volume floor below which it's actively counterproductive (false-aborts erode trust in the system and teams start clicking through overrides, defeating the purpose).
Symptom: promotions happen but rollback doesn't actually stop the bleeding — canary pods keep receiving traffic for a minute after abort.
Check trafficRouting sync lag: the Gateway API / Istio plugin patches the HTTPRoute/VirtualService, but propagation to the data plane (Envoy config sync) is not instantaneous — under load, Istio's xDS push can lag several seconds to tens of seconds across a large mesh. istioctl proxy-status shows sync state per Envoy; a consistently lagging subset of proxies points at pilot/istiod resource pressure, not an Argo Rollouts bug. Mitigation: tighten abortScaleDownDelaySeconds isn't the fix here — the fix is addressing control-plane push latency (istiod horizontal scaling, or reducing VirtualService fan-out) since Rollouts is only as fast as the traffic layer it's driving.
Symptom: at ~300 concurrent Rollout objects cluster-wide, analysis intervals start drifting late.
This is the Prometheus query-volume ceiling mentioned in Section 4. Each active AnalysisRun fires its own independent query on its own interval; at scale this is effectively an uncoordinated query storm against one Prometheus instance. prometheus_engine_query_duration_seconds and prometheus_engine_queries_concurrent_max reveal query queueing. Fixes, in order of effort: raise --query.max-concurrency, move to Thanos/Cortex/Mimir for horizontally-scaled query serving, or reduce per-rollout query cardinality (recording rules that pre-aggregate sum(rate(...)) instead of every AnalysisRun computing the same aggregation from raw series every interval — a very common miss).
7. Hands-on Lab
Reproduce a full canary-with-analysis loop, including an intentional failure, on a local kind cluster.
# 1. Cluster + controller
kind create cluster --name progressive-delivery-lab
kubectl create namespace argo-rollouts
kubectl apply -n argo-rollouts -f https://github.com/argoproj/argo-rollouts/releases/download/v1.10.0/install.yaml

# 2. kubectl plugin for rollout visibility
curl -LO https://github.com/argoproj/argo-rollouts/releases/download/v1.10.0/kubectl-argo-rollouts-linux-amd64
chmod +x kubectl-argo-rollouts-linux-amd64 && sudo mv kubectl-argo-rollouts-linux-amd64 /usr/local/bin/kubectl-argo-rollouts

# 3. Minimal Prometheus for analysis (kube-prometheus-stack)
helm repo add prometheus-community https://prometheus-community.github.io/helm-charts
helm install kube-prom prometheus-community/kube-prometheus-stack -n monitoring --create-namespace

# 4. Demo app: two versions, v1 healthy, v2 seeded to fail ~15% of requests
kubectl create namespace demo
cat <<'EOF' | kubectl apply -f -
apiVersion: argoproj.io/v1alpha1
kind: Rollout
metadata:
  name: demo-app
  namespace: demo
spec:
  replicas: 6
  strategy:
    canary:
      steps:
        - setWeight: 20
        - pause: { duration: 30s }
        - analysis:
            templates: [{ templateName: demo-analysis }]
        - setWeight: 60
        - pause: { duration: 30s }
        - setWeight: 100
  selector: { matchLabels: { app: demo-app } }
  template:
    metadata: { labels: { app: demo-app } }
    spec:
      containers:
        - name: demo
          image: kennethreitz/httpbin
          ports: [{ containerPort: 80 }]
---
apiVersion: argoproj.io/v1alpha1
kind: AnalysisTemplate
metadata: { name: demo-analysis, namespace: demo }
spec:
  metrics:
    - name: success-rate
      interval: 15s
      count: 3
      successCondition: result[0] >= 0.9
      provider:
        prometheus:
          address: http://kube-prom-kube-prometheus-stack-prometheus.monitoring:9090
          query: sum(rate(http_requests_total{app="demo-app",code=~"2.."}[1m])) / sum(rate(http_requests_total{app="demo-app"}[1m]))
EOF

# 5. Watch the rollout live
kubectl argo rollouts get rollout demo-app -n demo --watch

# 6. Trigger a bad version — image with a seeded 5xx rate — and watch auto-abort
kubectl argo rollouts set image demo-app -n demo demo=yourrepo/demo-app:broken-v2

# 7. Confirm abort behavior
kubectl argo rollouts status demo-app -n demo   # should report Degraded
kubectl argo rollouts get rollout demo-app -n demo   # canary weight back to 0
Validation: the --watch view should show the rollout pause at 20%, spawn an AnalysisRun, and — for the broken image — abort back to 0% canary weight within the 30-45s analysis window rather than continuing to 60/100%. Confirm stable pods (v1) served 100% of traffic throughout by checking http_requests_total label cardinality per version.
Cleanup:
kubectl delete namespace demo
helm uninstall kube-prom -n monitoring
kind delete cluster --name progressive-delivery-lab
8. Production Case Study
Netflix built Kayenta (open-sourced) specifically to solve the "is this canary statistically different from baseline" problem with rigor beyond simple threshold checks — using Mann-Whitney U tests and other nonparametric statistical comparisons across dozens of metrics simultaneously, producing a canary score rather than a binary pass/fail, with human judgment applied at score boundaries. The lesson platform teams borrow from this even without adopting Kayenta itself: a single metric threshold is a blunt instrument, and composite scoring across error rate, latency, saturation, and business KPIs catches regressions that no single metric would.
Google popularized the underlying practice at even larger scale inside Borg/GKE-adjacent tooling — canary analysis as a mandatory gate before binary promotion for internal services, with the explicit principle that canary and baseline must run concurrently, on comparable traffic, never sequentially (a canary run at 2am compared against a baseline run at 2pm during a previous deploy is not a valid comparison, because traffic shape differs).
Uber, running one of the largest microservice fleets in the industry, layered progressive delivery with automated rollback triggers tied directly to their internal SLO framework — the org-wide lesson being that progressive delivery only scales past a few dozen services if the analysis templates are centrally curated and versioned as shared infrastructure, not hand-written per team; teams writing their own PromQL from scratch is where quality (and trust) degrades fastest.
The common thread across all three: none of them treat automated canary analysis as "nice to have" tooling — it's treated as safety-critical infrastructure with its own SLOs, on-call rotation, and change-management process, because a bug in the analysis system itself (a query that always reports success) is worse than not having automated canary analysis at all — it creates false confidence.
9. Architecture Review
Strengths. Decoupling strategy (canary/blue-green state machine) from traffic mechanism (Gateway API/Istio/ALB plugin) is the architecture's best decision — it survives a service-mesh migration without a rewrite. GitOps-native operation means the entire rollout history is auditable through Git log, not a separate deployment-tool database. The relative-baseline analysis pattern is statistically sound and battle-tested at the companies that pioneered it.
Weaknesses. The controller is a single point of failure for promotion decisions cluster-wide, even though it's HA — a controller-wide bug or an upstream Prometheus outage stalls every in-flight rollout simultaneously, which is a correlated-failure risk the "each service has independent state machine" framing obscures. AnalysisTemplate quality is entirely a human authorship problem with no built-in guardrail against a badly-written query that always passes (the Netflix/Google lesson above). Multi-cluster blue/green as described relies on DNS-based global traffic management, which has propagation-delay and client-side DNS-caching failure modes that make "instant cutover" less instant than the architecture diagram implies in practice.
What breaks first at 10x scale (from ~300 to ~3,000 concurrent rollouts): Prometheus query volume, as covered in Section 6 — this is the first wall, well before the controller's own reconciliation loop struggles. Second: Gateway API/Istio control-plane push latency under a much higher rate of HTTPRoute/VirtualService mutation, since every canary step across thousands of rollouts is a config-plane write.
At 100 million users: the entire model needs a query-serving tier (Thanos/Mimir/Cortex) treated as core infrastructure with its own capacity planning, not an afterthought bolted onto a single Prometheus StatefulSet. Analysis queries should shift from raw-series aggregation to pre-computed recording rules universally, mandatory rather than best-practice. Traffic routing likely needs to move toward a mesh with distributed, locally-computed routing decisions (Cilium/eBPF-based, or ambient mesh with local Envoy config) rather than anything requiring synchronous central config-plane pushes on every canary step, to avoid the xDS-lag failure mode becoming the norm rather than the edge case.
What I'd redesign: a mandatory analysis-template linter/simulator in CI — replay historical incident traffic patterns (including the exact regression from Section 2's currency-conversion bug) against any new or modified AnalysisTemplate before it's allowed to merge, so a badly-written query that would have missed a known real incident is caught in review, not discovered in the next live incident.
10. Best Practices
Progressive delivery pays off in proportion to how disciplined the analysis layer is, not how sophisticated the traffic-routing layer is — teams over-invest in mesh tooling and under-invest in metric-query quality. Centralize AnalysisTemplates (or ClusterAnalysisTemplates) as shared, reviewed, versioned infrastructure rather than letting every team author their own from scratch; treat a bad query the same severity as a bad alert rule. Always compare canary against a concurrent stable baseline, never an absolute or historical threshold, and make sure the underlying metric has enough traffic volume for the statistical comparison to be meaningful — gate low-traffic services with longer soak windows instead of tight percentage thresholds. Run the controller HA and monitor its own health (reconciliation lag, AnalysisRun queue depth) as seriously as any other critical-path control-plane component. Size canary replica counts for statistical significance, not for mirroring stable capacity, to control cost. Pair infrastructure-level canaries (Rollouts) with application-level feature flags for defense in depth — they catch different failure classes. Practice the abort path in game days as often as the promote path; teams that only ever see successful rollouts in staging are unprepared for what an actual abort-and-rollback looks like operationally at 2 a.m.
11. Common Production Mistakes
A frequent anti-pattern is writing AnalysisTemplate queries against absolute thresholds copy-pasted from a runbook rather than relative-to-baseline comparisons, which silently stops working the moment overall traffic patterns shift (a new marketing campaign, a seasonal spike) and either false-aborts healthy deploys or — worse — lets a real regression through because the absolute threshold was set too loose. Another is setting canary steps and pause durations identically across every service regardless of risk tier, which either slows low-risk internal tools to a crawl or rushes payment-critical services through analysis windows too short to catch anything but the most obvious regressions. Teams frequently under-provision the metrics backend for the additional query load progressive delivery introduces, discovering the Prometheus ceiling only during an incident when everyone's rollouts stall simultaneously. Another common failure is treating abort as equivalent to rollback — an aborted canary halts promotion but doesn't automatically revert the Git-committed spec, so the next git push or Argo CD sync can accidentally re-trigger the same broken rollout if the underlying cause wasn't actually fixed. Finally, teams frequently skip testing the traffic-router integration itself in isolation (is the Gateway API plugin actually patching weights correctly under load, is xDS propagation fast enough) and only discover control-plane lag during a live incident when seconds matter.
12. Interview Preparation
Q: Why is relative canary-vs-baseline comparison preferred over absolute threshold checks in automated canary analysis, and what's the failure mode of each? A: Absolute thresholds don't account for external factors (traffic spikes, time-of-day patterns) affecting both canary and stable simultaneously — they produce false positives during anomalous-but-not-code-related conditions and false negatives when the threshold is set too loosely for normal variance. Relative comparison, measured concurrently against live stable traffic, controls for those external factors by construction — if both canary and stable degrade together, the relative delta stays near zero and the deploy correctly isn't blamed. The failure mode of relative comparison is low-traffic statistical noise, which is why sample-size gating matters as much as the comparison logic itself.
Q: Walk through what happens, end to end, when an AnalysisRun reports Failed mid-rollout.
A: The controller marks the current AnalysisRun Failed, sets the Rollout's canary weight to 0 via the traffic router plugin, transitions Rollout.status.phase to Degraded, and — per abortScaleDownDelaySeconds config — either immediately scales down canary pods or holds them briefly for debugging before garbage collection. The Rollout remains paused pointing at the last-good stable spec; it does not automatically revert the underlying Git-committed manifest, so a human or automation must either fix-forward and retry, or issue an explicit undo/Git revert to fully roll back.
Q: How would you design canary strategy differently for a stateless HTTP API vs. a Kafka consumer group? A: Stateless HTTP APIs suit standard weighted-traffic canary since partial exposure to a percentage of requests is safe and easily reversible. Consumer groups complicate this because partial exposure means partial exposure to a percentage of partitions/messages, and two consumer versions processing overlapping partitions can race or double-process depending on rebalance timing — this usually pushes toward blue/green (a full separate consumer group running the new version against a subset of partitions, or shadow-consuming without committing offsets, validated, then a full cutover) rather than gradual weighted shifting.
Q: Your Prometheus-backed analysis system starts reporting Inconclusive results across many concurrent rollouts simultaneously. How do you triage?
A: First check whether it's systemic (Prometheus itself under query-load pressure, timing out or truncating results — check prometheus_engine_query_duration_seconds and API server health) versus per-service (a specific query's data source problem, like a metric label rename breaking one team's query). Systemic points at capacity — query-serving tier scaling or reducing simultaneous query load via recording rules. Per-service points at a query or instrumentation regression, usually correlated with a recent change to the app's metric emission.
Q: What's the strongest argument against automated canary analysis, and how do you mitigate it?
A: False confidence — a badly-designed analysis system that always passes (or one gamed by a service intentionally not emitting failure-indicating metrics) is worse than no automation, because it removes the human skepticism that would otherwise catch the same regression through manual dashboard review. Mitigation is treating AnalysisTemplate authorship with the same rigor as alerting-rule review, centralizing and testing shared templates, and periodically replaying known historical incidents against the current analysis config to confirm it would still catch them.
13. Latest Industry Updates
Argo Rollouts v1.10.0 shipped 2026-08-05, following v1.9's graduation to General Availability announced at ArgoCon North America — the project has been steadily hardening its Gateway API integration and controller reliability (recent patch releases include fixes for ephemeral-metadata pod listing overhead in the controller's reconcile loop, and desired-replicas annotation syncing during abort/scale-down, both directly relevant to running the controller reliably at higher rollout concurrency, per the project's public release notes). Gateway API itself continues displacing vendor-specific Ingress annotations as the standard for weighted traffic splitting across the CNCF ecosystem, which is the direction Argo Rollouts' plugin model was explicitly built to ride. Service mesh vendors continuing the shift toward ambient/sidecar-less architectures (covered in a recent Istio ambient mesh session) changes the traffic-router integration surface over time — plugins that patch VirtualService objects are gradually being complemented by Gateway API-native HTTPRoute patching as meshes converge on that standard, which matters for platform teams planning a multi-year mesh roadmap alongside their progressive-delivery tooling. On the analysis side, the broader industry trend is toward AI-assisted anomaly detection layered on top of (not replacing) threshold/relative-comparison analysis — using historical deploy data to auto-tune successCondition sensitivity per service rather than requiring every team to hand-tune thresholds, though this remains more common in large in-house platforms (Netflix/Google-style) than in off-the-shelf open-source tooling today.
14. Summary & Cheat Sheet
Core concept: progressive delivery replaces "pod became Ready" as the promotion signal with "canary traffic proved statistically comparable-or-better behavior vs. a concurrent stable baseline," gated by an automated AnalysisRun loop that can promote or abort without waiting on a human.
Architecture in one line: Git → Argo CD sync → Rollout CRD → controller drives traffic-router plugin (Gateway API/Istio/ALB) through weighted steps → AnalysisTemplate queries Prometheus at each step → pass promotes, fail aborts-and-zeroes-canary-weight → multi-cluster blue/green composes the same loop at the regional level via ApplicationSet + global traffic manager.
Key commands:
kubectl argo rollouts get rollout <name> -n <ns> --watch     # live state machine view
kubectl argo rollouts status <name> -n <ns>                  # current phase
kubectl argo rollouts promote <name> -n <ns>                 # manual promote past a pause
kubectl argo rollouts abort <name> -n <ns>                   # manual abort
kubectl argo rollouts undo <name> -n <ns>                    # revert to prior revision
kubectl get analysisrun -n <ns> -l rollout=<name>             # inspect analysis state
Design patterns: relative canary-vs-baseline comparison over absolute thresholds; centralized, versioned AnalysisTemplate/ClusterAnalysisTemplate libraries over per-team hand-rolled queries; risk-tiered step/pause/analysis-window configuration; abort ≠ rollback (abort halts promotion, doesn't revert Git); canary replica count sized for statistical significance, not capacity mirroring.
Troubleshooting checklist: rollout stuck → check AnalysisRun status and describe for query errors; flapping pass/fail → check traffic volume against interval/count for statistical power; rollback not stopping traffic → check traffic-router control-plane push lag (istioctl proxy-status or Gateway API controller logs), not the Rollouts controller itself; analysis intervals drifting cluster-wide → check Prometheus query concurrency/queueing before assuming a controller bug.
Best-practice one-liner: invest in analysis-query quality before traffic-routing sophistication — the mesh you choose matters far less than whether your AnalysisTemplate would actually have caught your last real incident.