
Prometheus + Thanos at Scale: Taming Cardinality Explosions and Global Query Federation
Daily DevOps Mentor — 2026-09-10
1. Topic of the Day
Prometheus won the metrics war on a simple bet: a pull-based, dimensional, label-oriented time-series model with a query language expressive enough for alerting and dashboards, wrapped in a single static Go binary with local storage. That bet is exactly what makes it hard to run at fleet scale. Local TSDB storage means a single Prometheus instance owns a finite retention window and a finite cardinality budget before its WAL replay time, query latency, and memory footprint start degrading — and dimensional labels, the same feature that makes PromQL powerful, are the mechanism by which a single careless label_values() choice (a request ID, a pod UID, a raw user ID) turns a metric with 50 series into one with 50 million.
Thanos exists to solve the two problems Prometheus deliberately punts on: durable long-term storage beyond local disk, and a single query surface across many independent Prometheus instances spread across clusters, regions, and clouds. It does this without touching Prometheus's core model — no forked TSDB, no custom remote-write protocol required for the primary path — by wrapping each Prometheus with a sidecar that exposes its local blocks over a gRPC StoreAPI and periodically uploads 2-hour TSDB blocks to object storage, then layering a Querier that fans out StoreAPI calls across sidecars (real-time), Store Gateways (historical, object-storage-backed), and Receivers (for write-path aggregation from agents that can't run their own Prometheus) and deduplicates by replica label.
This matters at the scale organizations like Anthropic, OpenAI, Uber, and Datadog operate at because the failure mode isn't "Prometheus goes down" — it's "Prometheus becomes economically and operationally unsustainable." Cardinality growth is quietly exponential: every new microservice adds label dimensions, every Kubernetes upgrade adds new default labels, every well-intentioned engineer adding a user_id or request_id label to "improve debuggability" multiplies series count by the label's own cardinality. A metrics platform that isn't actively defended against this degrades from "queries return in 200ms" to "queries return in 40 seconds or OOM the Querier" over a period of months, with no single change anyone can point to as the cause — which is exactly why this is a senior platform engineering problem rather than a one-time setup task.
2026 sharpens this further: Prometheus 3.8 stabilized native histograms (a fundamentally more cardinality-efficient representation for latency/size distributions — one series instead of N le bucket series), AWS's Managed Service for Prometheus added native histogram support in June, and Grafana's Adaptive Metrics has made usage-based cardinality reduction a first-class, continuously-running control plane feature rather than a quarterly cleanup project. Today's session is the full production tour: architecture, the mechanics of cardinality explosions, how to detect and remediate them without breaking dashboards, and how global query federation actually works under the hood.
2. Real Business Problem
Scenario: You operate the observability platform for a multi-tenant SaaS company — 60 engineering teams, 400+ microservices, two Kubernetes clusters per region across three regions (us-east, eu-west, ap-south), backed by Thanos with S3-compatible per-region object storage and a global Grafana fleet.
Symptoms reported over a two-week period:
- Thanos Querier p99 latency for the main "Service Overview" dashboard has climbed from 800ms to 11 seconds. No single query is pathological; it's a slow, board-wide creep.
- Monthly object storage cost for the metrics bucket has grown 40% quarter-over-quarter with no corresponding growth in traffic, request volume, or team headcount.
- The Thanos Compactor is falling behind — its per-cycle compaction time has grown past the 2-hour block upload interval, meaning uncompacted blocks are piling up in object storage faster than they're being merged and downsampled.
- One specific Prometheus instance in the payments cluster OOMs roughly once a week under normal load, always preceded by a spike in
prometheus_tsdb_head_series. - A platform engineer runs
topk(10, count by (__name__)(...))-style cardinality queries and finds a single metric,http_request_duration_seconds_bucket, responsible for 38% of all active series cluster-wide — traced to a team that added acustomer_idlabel to a histogram on a customer-facing API two months ago, thinking it would help per-customer latency debugging. - No alert fired for any of this. Cardinality growth isn't a threshold-crossing event in the way CPU saturation is; it's a slope, and nobody had a standing SLI for "active series count" or "series growth rate" until the cost report forced the investigation.
This is deliberately the shape of a slow-burn platform failure rather than an outage: every individual signal (query latency, storage cost, compactor lag, one team's OOM) looks like a separate ticket, and the unifying root cause — unbounded, ungoverned label cardinality — is invisible unless the platform team has cardinality itself instrumented as a first-class metric.
3. Production Architecture
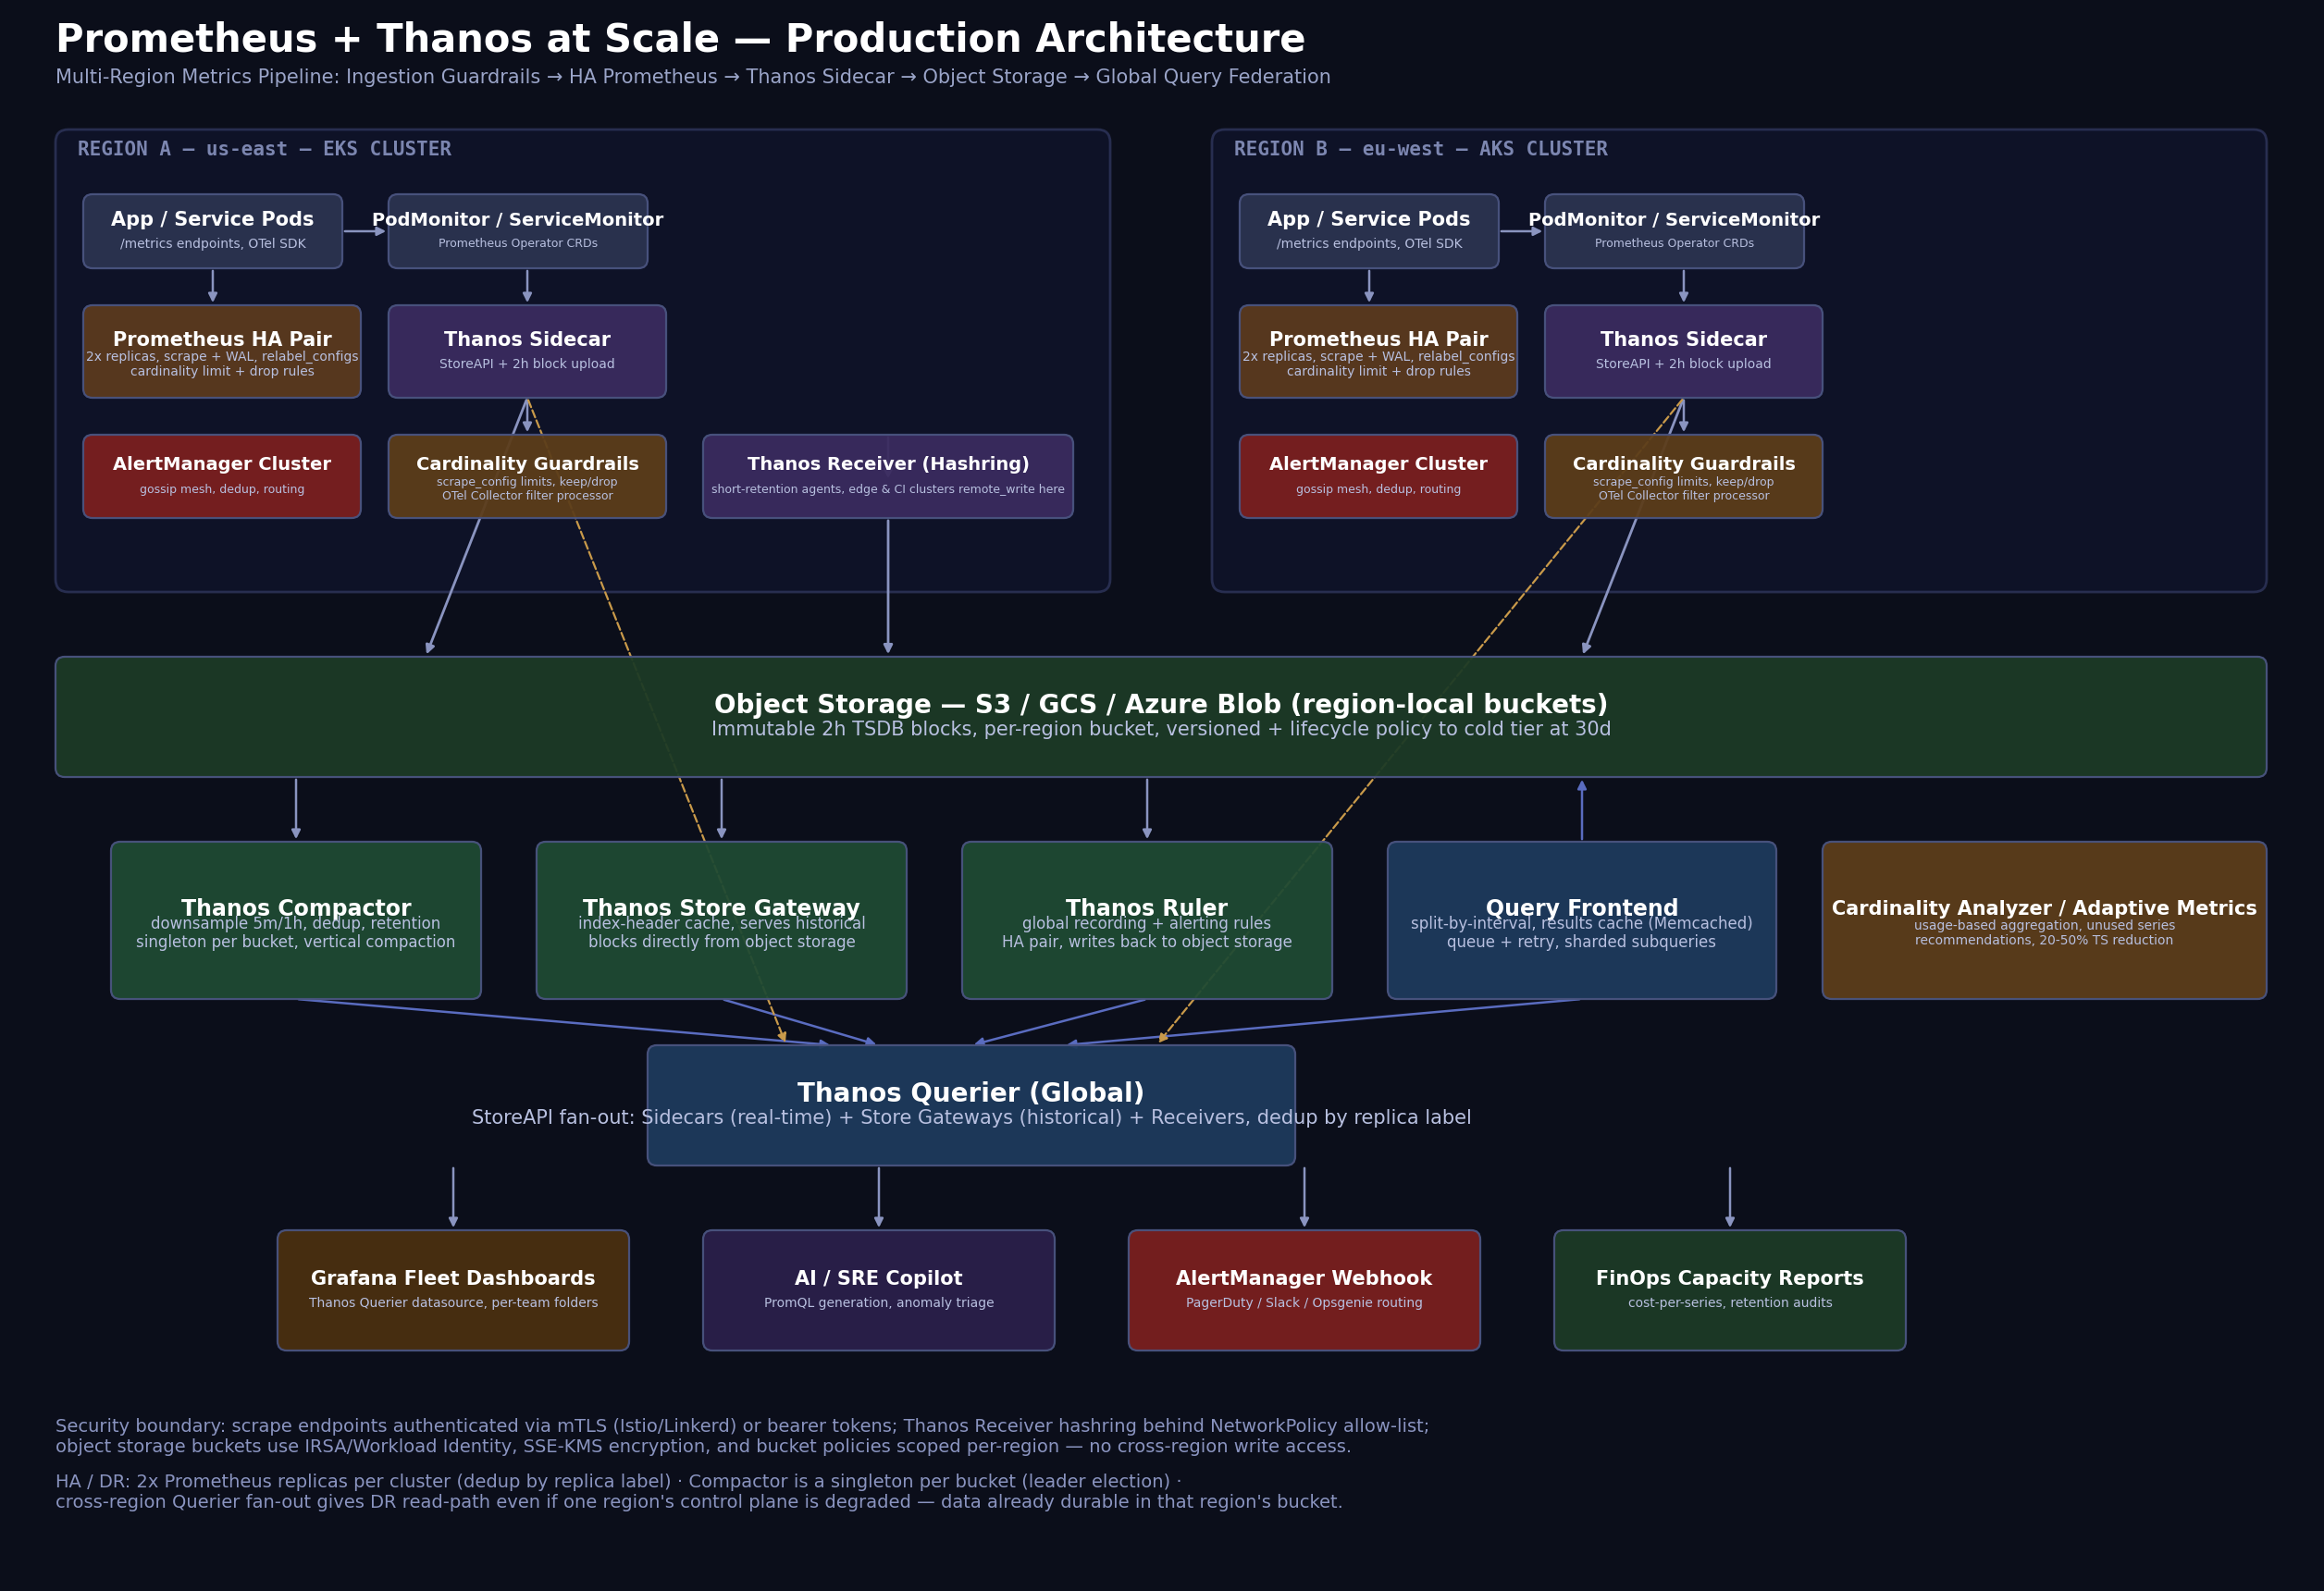
Why it's designed this way. The architecture separates four concerns that Prometheus alone conflates: scrape/collection (per-cluster Prometheus HA pairs), durable storage (region-local object storage buckets holding immutable 2-hour blocks), compaction/downsampling (a singleton Compactor per bucket), and query federation (a global Querier that fans StoreAPI calls out to every component that can answer them). This separation exists because each concern scales on a different axis — collection scales with the number of scrape targets and their cardinality, storage scales with retention and series count, compaction scales with block volume and CPU, and query scales with dashboard/alert fan-out and query complexity — and coupling them (as vanilla Prometheus does by necessity) means you can't scale one without over-provisioning the others.
Component interactions and data flow. Each Kubernetes cluster runs a Prometheus HA pair (two replicas scraping the same targets independently, distinguished by a replica label injected via external_labels) fronted by Prometheus Operator's PodMonitor/ServiceMonitor CRDs, which turn service discovery into a GitOps-managed, per-team-scoped configuration surface rather than a hand-edited scrape_configs block. Each Prometheus has a Thanos Sidecar attached, which does two things: exposes a gRPC StoreAPI so the global Querier can pull the last ~2 hours of not-yet-uploaded data directly (the "real-time" path, bypassing object storage entirely for freshness), and uploads completed 2-hour TSDB blocks to a region-local object storage bucket the moment they're written to disk. Workloads that can't run a full Prometheus (short-lived CI jobs, edge locations, lightweight agents) remote_write into a Thanos Receiver hashring instead, which ingests directly into its own local TSDB and uploads blocks the same way a Sidecar-backed Prometheus would — from the Querier's perspective, Receivers and Sidecars are just two more StoreAPI-speaking sources to fan out to.
Once blocks land in object storage, the Compactor — a singleton per bucket via leader election, because concurrent compaction on the same blocks causes corruption — continuously merges small 2-hour blocks into larger ones and produces downsampled resolutions (5-minute and 1-hour) so that a dashboard querying a 90-day range doesn't have to read millions of raw samples. The Store Gateway serves queries against these object-storage-resident blocks by keeping only index headers in memory (not full block content), which is what makes it possible to serve queries against petabytes of historical data without a proportional memory footprint. The Thanos Ruler evaluates global recording and alerting rules that need a cross-cluster view (SLO burn-rate alerts spanning both replicas and both regions, for instance) and writes its own results back to object storage as just another block source. The Query Frontend sits in front of the Querier doing query splitting (breaking a 30-day range query into daily sub-queries executed in parallel), results caching against Memcached, and request queuing — this is the component that turns "one slow tenant query" from a fleet-wide latency incident into an isolated, retried, cached-on-next-hit event.
Security boundaries. Scrape endpoints are authenticated via mesh mTLS (Istio/Linkerd) or bearer tokens issued per-ServiceMonitor, so a compromised pod can't scrape arbitrary /metrics endpoints outside its own namespace's monitoring scope. The Thanos Receiver hashring sits behind a NetworkPolicy allow-list — it's a write path into the metrics system, and an open write path is an exfiltration and cardinality-bombing risk simultaneously, since anyone who can remote_write can also inject unbounded label cardinality directly, bypassing any scrape-time guardrails. Object storage buckets use IRSA (AWS) or Workload Identity (GCP/Azure) scoped per-region with no cross-region write grants — a Sidecar in us-east physically cannot write to the eu-west bucket even if compromised, which bounds blast radius to a single region's data.
High availability and disaster recovery. The 2x Prometheus replica pattern combined with Querier-side deduplication by replica label means either replica can be lost without a query-visible gap — the Querier simply serves from whichever replica has data for a given time range. The Compactor being a singleton is the one deliberate SPOF in the write path, mitigated by keeping its blast radius contained: if it's down, blocks simply accumulate unmerged in object storage (degraded query performance on long ranges, not data loss) until it recovers. DR for the whole system is close to free by construction — object storage is already durably replicated by the cloud provider, and because the Querier fans out across regions, a full regional control-plane outage (EKS control plane down, but the bucket and its data survive) still leaves historical queries servable from the Store Gateway reading that region's bucket from wherever the Querier itself is running.
Multi-region and multi-cloud considerations. Each region keeps its own bucket, Compactor, and Store Gateway — there's no cross-region replication of raw blocks, which keeps both egress cost and blast radius bounded. The global Querier (often itself deployed redundantly in 2+ regions behind a global load balancer) is the only component that needs network reachability to every region's Store Gateway and every cluster's Sidecar/Receiver, which is a meaningfully smaller cross-region network surface than replicating all data everywhere. In multi-cloud deployments, this same pattern extends cleanly because the StoreAPI is a gRPC contract, not a storage-backend-specific protocol — an AKS cluster's Thanos stack and an EKS cluster's Thanos stack both just look like more StoreAPI sources to a cloud-agnostic Querier.
Evolution at scale. Below ~200 active scrape targets per cluster, a single Prometheus with no Thanos is genuinely fine — don't add this complexity prematurely. Between roughly 200 and a few thousand targets per cluster, or once you need more than the ~15-day local retention Prometheus comfortably holds, the Sidecar + object storage + Querier pattern described here is the standard answer. Beyond that, the constraint shifts to cardinality itself rather than target count or retention — this is when Adaptive Metrics-style usage-based aggregation, native histograms (replacing N classic-histogram bucket series with one exponential-bucket series per metric), and hard per-tenant series limits enforced at scrape time become mandatory rather than optional, because no amount of Compactor or Store Gateway scaling fixes a problem that originates in how many unique label combinations are being written in the first place.
4. Solution Design
Design decisions and the alternatives considered.
Thanos vs. Cortex/Mimir vs. VictoriaMetrics for long-term storage and federation. Thanos, Grafana Mimir (Cortex's spiritual successor), and VictoriaMetrics all solve overlapping problems but with different architectural bets. Thanos keeps Prometheus as the ingestion tier unchanged and bolts on storage/federation as sidecars and a separate query layer — lowest migration cost if you're already running vanilla Prometheus Operator everywhere, and the object-storage-first design means storage cost scales with actual data volume rather than a proprietary ingestion cluster's provisioned capacity. Mimir replaces the ingestion tier with its own horizontally-scalable ingesters and is generally the stronger choice when you're building a managed multi-tenant metrics platform from scratch (it's what backs Grafana Cloud) and want tighter tenant isolation and quota enforcement built into the ingestion path itself rather than bolted on via scrape-time relabeling. VictoriaMetrics takes a more radically storage-engine-first approach — its own columnar storage format handles high-cardinality workloads with materially better compression and query performance in published benchmarks, at the cost of not being "just Prometheus plus a sidecar," which matters if your organization has deep operational muscle memory and tooling built around vanilla Prometheus semantics. For a platform already standardized on Prometheus Operator and CRD-driven scrape config — the common case in Kubernetes-native shops — Thanos is the lowest-friction choice; teams building a metrics platform as a product for external tenants increasingly reach for Mimir or VictoriaMetrics first.
Sidecar-based upload vs. remote_write to Receiver for every source. The Sidecar pattern keeps each Prometheus's local TSDB as the source of truth and uploads completed blocks — this is efficient (block upload, not per-sample network chatter) and lets each Prometheus be queried directly for the freshest data. Routing everything through Receivers via remote_write centralizes ingestion (useful for enforcing tenant quotas and cardinality limits at a single choke point) but adds a network hop and a second TSDB write path for every sample, plus Receiver hashring capacity becomes a new scaling bottleneck. The pragmatic default is Sidecar for anything that can run its own Prometheus, Receiver only for sources that genuinely can't (ephemeral CI runners, edge devices, non-Kubernetes hosts).
Pros and cons, scalability, cost, security, and performance implications. Object-storage-backed long-term retention is dramatically cheaper per GB-month than scaling local SSD-backed Prometheus retention (S3 Standard-IA or equivalent versus provisioned EBS/PD), but introduces query latency for historical ranges (Store Gateway index-header lookups plus object storage GET latency versus local disk) — mitigated by the Query Frontend's caching and by downsampled resolutions for long ranges, but a real trade-off that shows up if teams expect raw-resolution 90-day dashboards to feel as fast as a 1-hour dashboard. Security posture improves relative to a sprawl of unmanaged per-team Prometheus instances because there's one governed ingestion path with consistent mTLS/token auth and one set of IAM-scoped buckets rather than N teams each making their own (often weaker) decisions. The single biggest performance lever, by a wide margin, is upstream cardinality control — no downstream architecture choice compensates for a metric that's structurally unbounded (any label with unbounded or high-unique-value cardinality: user IDs, request IDs, raw email addresses, full URLs with query strings, pod UIDs used instead of pod names).
5. Deep Technical Walkthrough
Internal working — what "cardinality" actually costs. Every unique combination of metric name and label set is a distinct time series in Prometheus's TSDB, each with its own chunk of in-memory "head" data (roughly 1-3KB per series of constant overhead regardless of sample count, from index structures alone) plus per-sample storage. A histogram with 10 le buckets and a newly-added customer_id label with 50,000 distinct values doesn't add 50,000 series — it multiplies: 10 buckets × 50,000 customers × (however many other label dimensions already existed) = potentially millions of new series from one line of instrumentation code. prometheus_tsdb_head_series is the leading indicator; prometheus_tsdb_head_chunks and process RSS are the lagging indicators that show up as OOMs once head series growth has already happened.
Request/query flow through the global Querier. A PromQL query hits the Query Frontend, which splits range queries into shards (e.g., daily intervals for a multi-week range) and checks the results cache for each shard. Cache misses go to the Querier, which resolves the query's time range against its known StoreAPI sources: for the last ~2 hours, Sidecars (fastest, freshest); for older data, Store Gateways (reading object storage index headers, fetching only the chunks needed to answer the specific query rather than whole blocks); for any Receiver-ingested series, the Receiver's own StoreAPI. Results from all sources are merged and deduplicated — critically, by replica label, so the two HA Prometheus replicas' overlapping data doesn't get double-counted or presented as two separate series to PromQL functions like rate().
Control plane vs. data plane interactions. The "control plane" here is Prometheus Operator reconciling PodMonitor/ServiceMonitor/PrometheusRule CRDs into actual scrape configurations and rule files, watched and regenerated on every change — this is a Kubernetes-API-driven loop, not a data-path concern, but it's where cardinality governance lives: relabel_configs with action: drop or action: keep at scrape time is the single most effective enforcement point, because it prevents high-cardinality series from ever entering the TSDB rather than trying to clean them up after ingestion. The "data plane" is the scrape → WAL → block → upload → compact → serve pipeline, which has no awareness of why a series exists, only that it does.
Failure scenarios and recovery mechanisms. If a Prometheus replica OOMs from a cardinality spike, the Operator restarts it; WAL replay on restart is itself proportional to head series count, so a severely cardinality-bloated instance can enter a crash loop where it OOMs again during replay before finishing startup — the only recovery in that state is emergency relabel_configs deployment to drop the offending series before the pod restarts, or in the worst case, wiping the PVC and accepting a gap. If the Compactor falls behind (as in the Section 2 scenario), object storage cost grows because uncompacted small blocks aren't being merged or downsampled, and query latency on long ranges degrades because the Store Gateway has to touch more, smaller blocks per query — recovery is either vertically scaling the Compactor (it's single-threaded per bucket by design, so this means more CPU/memory per replica, not more replicas) or, more sustainably, reducing the ingested cardinality so there's simply less data to compact.
Performance bottlenecks and scaling behavior. Query Frontend sharding and caching scale query throughput roughly linearly with added Frontend replicas for cache-hit-heavy workloads. Store Gateway scaling is bound by index-header memory — sharding Store Gateways by block time range or by tenant (via the --selector.relabel-config sharding mechanism) is the standard lever once a single Store Gateway's memory footprint becomes unwieldy. None of these scale cardinality itself down — they scale the system's ability to serve whatever cardinality exists, which is precisely why cardinality governance has to be a separate, proactive discipline rather than something infrastructure scaling can absorb indefinitely.
6. Production Troubleshooting
Symptoms (recap from Section 2): Querier p99 climbing, object storage cost growing disproportionately, Compactor falling behind, one Prometheus OOMing weekly, and a single metric found responsible for 38% of active series.
Step-by-step investigation, the way a senior SRE would run it:
- Confirm and quantify with
prometheus_tsdb_head_seriesand a cardinality-by-metric query, run against every Prometheus instance, not just the suspected one:
topk(15, count by (__name__)(
  {__name__=~".+"}
))
- Break down the worst offender by label to find which specific label is driving the explosion, not just which metric:
count by (customer_id)(
  http_request_duration_seconds_bucket
)
A result with tens of thousands of distinct customer_id values on a single metric is the smoking gun — confirmed by cross-referencing with count(count by (customer_id)(http_request_duration_seconds_bucket)).
Correlate against
prometheus_tsdb_head_seriesgrowth rate over time in Grafana to establish when the change was introduced — this pinpoints it to the deploy that added the label, turning "we have a cardinality problem" into "team X's deploy on date Y caused this," which is what actually gets a fix prioritized and shipped.Check
prometheus_tsdb_symbol_table_size_bytesand process RSS to confirm the OOM correlation, and check Thanos Compactor's own metrics (thanos_compact_group_compactions_duration_seconds,thanos_compact_todo_compactions) to quantify backlog growth.Root cause: an engineer instrumented a histogram with
customer_idas a label "to make per-customer P99 debugging easier in Grafana" — a well-intentioned change that violates the fundamental rule that label cardinality must be bounded by a small, known, slowly-changing set of values (HTTP method, status code class, route template — never a user-supplied or database-primary-key value).
Remediation, in order of urgency:
# Immediate: drop the offending label at scrape time via relabel_configs
# (stops the bleeding without requiring an application redeploy)
metricRelabelings:
  - sourceLabels: [__name__]
    regex: 'http_request_duration_seconds_bucket'
    action: keep
    targetLabel: __tmp_match
  - sourceLabels: [customer_id]
    regex: '(.+)'
    targetLabel: customer_id
    replacement: ''
    action: replace
# Verify the drop took effect — series count for the metric should fall
# sharply within one scrape interval
count(http_request_duration_seconds_bucket)
# Durable fix: application-level change to use a bounded label instead,
# plus a PrometheusRule-adjacent admission check (see Section 9/10) that
# rejects metric names/labels matching a high-cardinality pattern before
# they reach production scrape configs.
- Recovery validation: confirm
prometheus_tsdb_head_seriesdrops back to baseline, confirm the OOM-prone instance stabilizes over the following week, and confirm Compactor backlog (thanos_compact_todo_compactions) trends back to zero over the following few compaction cycles as the bloated blocks age out of retention.
7. Hands-on Lab
Objective: Stand up a minimal Prometheus + Thanos Sidecar + MinIO (S3-compatible) + Querier stack locally, simulate a cardinality explosion, detect it, and remediate it with relabel_configs.
# 1. Kind cluster
kind create cluster --name thanos-lab

# 2. MinIO as local object storage
kubectl create namespace observability
helm repo add minio https://charts.min.io/
helm install minio minio/minio -n observability \
  --set rootUser=minio,rootPassword=minio123 \
  --set persistence.enabled=false

kubectl -n observability port-forward svc/minio 9000:9000 &
mc alias set local http://localhost:9000 minio minio123
mc mb local/thanos-blocks

# 3. Prometheus Operator + a Prometheus CR with a Thanos sidecar
helm repo add prometheus-community https://prometheus-community.github.io/helm-charts
helm install kps prometheus-community/kube-prometheus-stack -n observability \
  --set prometheus.prometheusSpec.thanos.image=quay.io/thanos/thanos:v0.37.0 \
  --set prometheus.prometheusSpec.retention=6h
# 4. Thanos sidecar objstore config (kubectl create secret from this)
type: S3
config:
  bucket: "thanos-blocks"
  endpoint: "minio.observability.svc:9000"
  access_key: "minio"
  secret_key: "minio123"
  insecure: true
# 5. Deploy Thanos Querier pointed at the sidecar StoreAPI
kubectl apply -f - <<'EOF'
apiVersion: apps/v1
kind: Deployment
metadata:
  name: thanos-querier
  namespace: observability
spec:
  replicas: 1
  selector: { matchLabels: { app: thanos-querier } }
  template:
    metadata: { labels: { app: thanos-querier } }
    spec:
      containers:
        - name: querier
          image: quay.io/thanos/thanos:v0.37.0
          args:
            - query
            - --store=dnssrv+_grpc._tcp.kps-kube-prometheus-stack-prometheus.observability.svc
          ports: [{ containerPort: 10902 }]
EOF

# 6. Simulate a cardinality explosion with a synthetic exporter
cat <<'EOF' > cardinality_bomb.py
from prometheus_client import start_http_server, Histogram
import random, time
h = Histogram('http_request_duration_seconds', 'sim', ['customer_id'])
start_http_server(8000)
while True:
    h.labels(customer_id=f"cust-{random.randint(1,50000)}").observe(random.random())
    time.sleep(0.001)
EOF
python3 cardinality_bomb.py &

# 7. Observe head series growth
kubectl -n observability exec -it prometheus-kps-0 -- \
  wget -qO- localhost:9090/api/v1/query?query=prometheus_tsdb_head_series

# 8. Remediate: apply a metricRelabelings drop rule to the ServiceMonitor
#    scraping the synthetic exporter, confirm series count falls, then
#    tear down the bomb.
kill %1
Validation: query count(http_request_duration_seconds_bucket) before and after applying the relabel rule and confirm the drop; check thanos_compact_todo_compactions stays at zero throughout since block volume in this lab is small.
Cleanup:
kind delete cluster --name thanos-lab
8. Production Case Study
Uber's M3/metrics evolution is one of the most publicly documented examples of this exact problem at extreme scale — Uber's engineering blog has detailed how their internal metrics platform had to solve cardinality explosion and multi-region federation years before Thanos existed, ultimately building M3DB, a purpose-built distributed time-series database, specifically because off-the-shelf Prometheus-adjacent tooling at the time couldn't absorb their cardinality growth rate. The architectural lesson generalizes even though the specific technology differs: at sufficient scale, cardinality governance stops being a "best practice" and becomes a hard platform requirement enforced by tooling, not policy documents.
Grafana Labs' own Grafana Cloud, which runs Mimir at a scale serving thousands of tenants, is the direct commercial validation of the usage-based aggregation approach referenced throughout this session — Adaptive Metrics exists because Grafana Labs had to solve, for paying customers, the exact problem in Section 2: teams instrument high-cardinality metrics with good intentions, usage patterns show most of that cardinality is never actually queried, and the fix is continuous, automated, usage-informed aggregation rather than a one-time audit.
Netflix's approach to telemetry at scale (via their Atlas system and more recently increased OpenTelemetry adoption) leans toward dimensional but tightly-governed metric schemas enforced at the client-library level — cardinality control as a platform-provided SDK constraint rather than a downstream cleanup process, which is the direction the OpenTelemetry ecosystem broadly is pushing the whole industry: catch the problem at instrumentation time, not at query time three months later.
9. Architecture Review
Strengths. Clean separation of ingestion, storage, compaction, and query concerns means each scales independently; object-storage-first design keeps long-term retention cost proportional to actual data rather than provisioned cluster capacity; the StoreAPI abstraction means the Querier doesn't care whether it's talking to a Sidecar, a Receiver, or a Store Gateway, which makes the system extensible (new data sources just need to speak StoreAPI) and cloud-agnostic.
Weaknesses. The Compactor singleton-per-bucket is a real architectural pressure point — it doesn't horizontally scale, and Section 6's failure scenario (Compactor falling behind) is a structural risk that only gets worse as data volume grows, not something the current design resolves on its own. The system has no built-in cardinality enforcement — Thanos and Prometheus will happily ingest and store however many series you send them; every guardrail described in this session (relabel_configs drops, Adaptive Metrics, admission-time schema checks) is bolted on, not structural, which means governance discipline is doing load-bearing work that architecture alone doesn't provide.
What fails first at 10x scale. The Compactor, almost certainly — a 10x increase in ingested series means a 10x increase in block volume per compaction cycle, and since it's fundamentally single-threaded per bucket, the only lever is vertical scaling, which has a ceiling. Second is Store Gateway memory for index headers if bucket sharding hasn't been implemented proactively.
What changes at 100 million users' worth of scale. At that scale, you're very likely not running Thanos-on-vanilla-Prometheus anymore — you're running Mimir or a purpose-built system like Uber's M3DB, because the ingestion tier itself (not just storage/query) needs horizontal scalability with built-in per-tenant quota enforcement, and you need Compactor-equivalent components that shard by tenant and time range from day one rather than as a later retrofit. Native histograms and continuous usage-based aggregation stop being optimizations and become load-bearing requirements for the system to function economically at all.
What I'd redesign knowing this in advance. Enforce cardinality limits at the Prometheus scrape-config and Receiver-ingestion level from day one via sample_limit/series_limit (available in recent Prometheus versions) rather than adding them reactively after the first incident, and shard the Compactor and Store Gateway by tenant/team from the start so a single team's cardinality mistake has a bounded blast radius on shared infrastructure rather than degrading the whole platform's Compactor backlog.
10. Best Practices
Reliability. Run Prometheus in HA pairs with replica external labels and rely on Querier-side dedup rather than a single instance per cluster; keep the Compactor's resource requests generous relative to current block volume so it never falls structurally behind.
Scalability. Shard Store Gateways and Compactors by tenant or time range before you need to, not after; treat prometheus_tsdb_head_series and its growth rate as capacity-planning inputs on the same footing as CPU and memory.
Observability (of the observability system itself). Instrument cardinality as a first-class SLI — active series count, series growth rate per team/namespace, and top-N metrics by series count, alerted on slope, not just absolute threshold, so a slow-burn problem like Section 2's doesn't go undetected for weeks.
Security. Authenticate every scrape endpoint and every Receiver write path; scope object storage IAM per-region with no cross-region write access; never let raw PII (customer IDs, emails, request payload fragments) become label values — this is a cardinality problem and a data-governance/compliance problem simultaneously.
Cost Optimization. Downsample aggressively for long-range dashboards (5m/1h resolutions are usually indistinguishable to the human eye on a 90-day graph from raw resolution); adopt native histograms where classic histograms are in use, since they collapse N bucket series into one; run continuous usage-based aggregation (Adaptive Metrics or an equivalent open-source approach using prometheus_engine_query_samples_total correlated against series-level usage) rather than one-off cardinality cleanups.
Performance. Push query result caching and range-splitting via the Query Frontend rather than relying on the Querier alone; keep recording rules for expensive, frequently-dashboarded queries so PromQL aggregation cost is paid once per evaluation interval, not once per dashboard load.
Maintainability. Keep PodMonitor/ServiceMonitor/PrometheusRule definitions in GitOps with mandatory review, specifically reviewing any new label added to an existing metric — this is the single highest-leverage code review checkpoint for preventing cardinality incidents before they happen.
Operational Excellence. Bake sample_limit/series_limit and metric-name/label linting into the platform's default Prometheus Operator config and CI checks so a new team's ServiceMonitor can't ship an unbounded-cardinality metric without an explicit, reviewed override.
11. Common Production Mistakes
Adding high-cardinality labels "for debuggability" — user IDs, request IDs, raw email addresses, full URL paths with query strings — without recognizing that every such label is a standing multiplier on total series count, not a one-time cost.
Treating object storage cost growth as a storage problem rather than an ingestion problem — buying more retention-cost budget instead of asking why series count is growing, which just delays and compounds the eventual reckoning.
No standing cardinality SLI or alert, so growth is only discovered via a cost report or an outage rather than a dashboard the platform team checks proactively — cardinality, unlike CPU or memory, has no natural saturation alarm bell until something else (Compactor, Querier, a specific Prometheus instance) breaks downstream.
Scaling infrastructure instead of fixing the source — throwing more CPU/memory at the Compactor or Store Gateway when the actual fix is a relabel_configs drop rule or an application-level instrumentation change, which is cheaper, faster, and addresses the root cause rather than the symptom.
Running the Compactor as a single fixed-size replica indefinitely without revisiting its resource allocation as ingested data volume grows, leading to exactly the backlog scenario in Section 2 — this is a "remember to check" failure mode that should instead be a standing capacity-review checklist item.
12. Interview Preparation
Q: Why does adding a single label to an existing metric sometimes cause a production incident? A: Because Prometheus's data model multiplies, not adds — a metric with 10 existing label combinations that gains a new label with 50,000 distinct values becomes 500,000 series, not 50,010. This directly inflates head series count (and its associated per-series memory overhead, roughly 1-3KB regardless of sample volume), WAL replay time, query fan-out cost, and downstream object storage volume, all from what looks like a one-line instrumentation change.
Q: How does Thanos achieve global query federation without a single centralized ingestion point? A: Via the StoreAPI gRPC contract — Sidecars, Receivers, and Store Gateways all implement the same interface, exposing whatever time range of data they hold. The Querier fans a query out to every registered StoreAPI source, merges results, and deduplicates by replica label. This means there's no single ingestion bottleneck; each cluster's Prometheus instances remain independent, and federation is purely a query-time concern layered on top.
Q: Why is the Thanos Compactor a singleton, and what's the operational risk of that design? A: Concurrent compaction against the same object storage blocks by multiple Compactor instances risks corrupting the index and producing incorrect merged blocks, so Thanos enforces leader election to guarantee exactly one active Compactor per bucket. The operational risk is that it doesn't horizontally scale — if ingested data volume outpaces a single Compactor's throughput even after vertical scaling, blocks accumulate unmerged, degrading long-range query performance and inflating storage cost, with no distributed-compaction escape hatch in the base architecture.
Q: What's the difference between classic histograms and native histograms, and why does it matter for cardinality?
A: Classic histograms represent each le bucket boundary as a separate time series (_bucket{le="0.1"}, _bucket{le="0.5"}, etc.), so a histogram with 10 buckets and any additional label dimensions multiplies cardinality by 10. Native histograms (stable since Prometheus 3.8) store the entire distribution as a single series using a compact, exponentially-bucketed sparse representation, collapsing that 10x multiplier to 1x — a direct, structural cardinality win with no loss of query expressiveness for histogram_quantile()-style analysis.
Q: How would you detect and remediate a cardinality explosion in production without downtime?
A: Detect via count by (__name__)(...) and per-label breakdowns (count by (<suspect_label>)(<metric>)) correlated against prometheus_tsdb_head_series growth over time to identify both the offending metric and the deploy that introduced it. Remediate immediately via metricRelabelings with an action: drop/replace rule on the offending label at scrape time — this takes effect within one scrape interval and requires no application redeploy — then follow up with a durable application-level instrumentation fix and, ideally, a sample_limit/series_limit guardrail to prevent recurrence.
13. Latest Industry Updates
- Native histograms are now a stable Prometheus feature as of v3.8.0, continuing to mature through the v3.13.0 LTS release on July 1, 2026 — teams still emitting classic histograms should treat migration as a structural cardinality-reduction project, not a nice-to-have, given the direct series-count multiplier it removes. Prometheus blog
- AWS's Managed Service for Prometheus added native histogram support in June 2026, closing a gap that had made self-hosted Thanos/Mimir the only option for teams wanting this feature on managed infrastructure — worth revisiting a "should we self-host or go managed" decision if that gap was the deciding factor. AWS announcement
- Grafana Cloud's Adaptive Metrics is now enabled by default across all tiers, including the free tier, and reports 20-50% time-series reduction with zero application changes by analyzing actual dashboard/alert/recording-rule usage and recommending safe aggregations — this validates usage-based, continuously-running cardinality management as the industry direction over one-off manual audits. Grafana Labs
- Prometheus 3.x's native OTLP ingestion (the
/api/v1/otlp/v1/metricsendpoint) plus UTF-8 metric-name support in PromQL are accelerating direct OpenTelemetry-to-Prometheus pipelines without an intermediate translation layer — relevant because OpenTelemetry's client-side cardinality controls (attribute limits, views) are increasingly the earliest point in the pipeline where cardinality can be governed, shifting the enforcement point further upstream than scrape-time relabeling. - PromCon EU 2026 (Munich, Oct 7-8) continues to be the primary venue where cardinality management, native histograms, and Thanos/Mimir/VictoriaMetrics operational patterns get the most current, practitioner-level treatment — worth tracking talk recordings for teams actively working on this class of problem.
14. Summary & Cheat Sheet
Key concepts: Cardinality is multiplicative, not additive — every new label dimension multiplies existing series count by that label's distinct-value count. Thanos separates ingestion (Prometheus + Sidecar/Receiver), durable storage (region-local object storage), compaction (singleton-per-bucket Compactor), and global query (Querier fanning out over StoreAPI to Sidecars/Receivers/Store Gateways, deduplicated by replica label). No downstream architecture compensates for unbounded upstream cardinality — governance has to happen at or before scrape time.
Architecture: App pods → PodMonitor/ServiceMonitor → Prometheus HA pair (with relabel-time cardinality guardrails) → Thanos Sidecar → object storage (2h blocks) → Compactor (merge/downsample) + Store Gateway (serve historical) + Ruler (global rules) → Query Frontend (split/cache) → Querier (StoreAPI fan-out + dedup) → Grafana/AlertManager/FinOps consumers.
Commands:
# Top metrics by series count
topk(15, count by (__name__)({__name__=~".+"}))

# Cardinality breakdown by a specific suspect label
count by (customer_id)(http_request_duration_seconds_bucket)

# Head series and growth trend
prometheus_tsdb_head_series
rate(prometheus_tsdb_head_series[1h])
# Scrape-time cardinality guardrail
metricRelabelings:
  - sourceLabels: [customer_id]
    regex: '(.+)'
    targetLabel: customer_id
    replacement: ''
    action: replace
Best practices: HA Prometheus pairs with replica-label dedup; shard Compactor/Store Gateway by tenant before you need to; downsample aggressively; adopt native histograms; enforce sample_limit/series_limit at scrape config by default; treat cardinality growth rate as a standing SLI, not a post-incident discovery.
Design patterns: object-storage-as-source-of-truth with a thin, stateless query-federation layer on top — the same pattern shows up in log aggregation (Loki) and trace storage (Tempo), worth recognizing as a general observability-at-scale primitive rather than a Thanos-specific trick.
Troubleshooting checklist:
- Confirm via
prometheus_tsdb_head_seriesgrowth rate, not just absolute value. - Identify the offending metric via
count by (__name__), then the offending label viacount by (<label>)(<metric>). - Correlate against deploy history to find the introducing change.
- Remediate immediately with a scrape-time
relabel_configsdrop; confirm series count falls within one scrape interval. - Follow up with an application-level fix and a
sample_limit/series_limitguardrail to prevent recurrence. - Verify downstream recovery: Compactor backlog trending to zero, OOM-prone instances stabilizing, Querier p99 returning to baseline.
Daily DevOps Mentor is a running series on production-grade cloud-native and AI infrastructure engineering — architecture, trade-offs, debugging, and scaling decisions at the level expected of Principal/Staff engineers operating platforms at enterprise scale.