
Kubernetes API Server Latency at Scale: Diagnosing and Scaling the Control Plane
Daily DevOps Mentor — 2026-09-02
1. Topic of the Day
Every other piece of the platform — schedulers, controllers, service meshes, GitOps reconcilers, the AI inference platforms covered in recent sessions — assumes one thing is fast and always available: the Kubernetes API server. It is the single serialization point for every read and every write in the cluster. When it degrades, it doesn't degrade one subsystem; it degrades everything simultaneously, because kubelets, controllers, schedulers, admission webhooks, and every kubectl invocation on the platform all funnel through the same request path.
The API server exists as a deliberate architectural choice: Kubernetes could have let controllers talk to etcd directly, but instead it centralizes all access behind a stateless HTTP API that owns authentication, authorization, admission, validation, and the watch/notify semantics the rest of the ecosystem depends on. That centralization is what makes Kubernetes's extension model possible — CRDs, admission webhooks, aggregated API servers — but it also means the API server is the cluster's narrowest chokepoint, and at fleet scale (thousands of nodes, tens of thousands of pods, hundreds of controllers watching in parallel) it becomes the thing that pages you at 2 a.m.
This matters more in 2026 than it did five years ago for a specific reason: AI/ML workloads changed the shape of API server load. A GPU training job with gang-scheduled pods, a KServe InferenceService doing rapid scale-to-zero/scale-from-zero cycles, or a Ray cluster's autoscaler reconciling hundreds of worker pods a minute generates a fundamentally different load profile than a steady-state web service fleet — bursty, high-churn, heavy on LIST/WATCH, and often running through several layers of client-go informers per controller. Kubernetes 1.37 ("Garhwal," released August 2026) explicitly acknowledges this shift: gang scheduling reached Beta and HPA scale-to-zero is now Beta and on by default, both of which increase control-plane churn precisely when platform teams are trying to reduce GPU idle cost.
Today's session covers why API server latency degrades non-linearly past certain thresholds, how to design a control plane that stays flat under 5,000+ node / 100,000+ pod load, the internal request lifecycle from TCP accept to etcd commit and back, how to root-cause a live latency incident using the same signals SIG API Machinery engineers use, and where this discipline is headed with the snapshottable watch cache and resilient watch cache initialization that graduated in 1.34.
2. Real Business Problem
Symptom: A platform team runs a shared EKS cluster backing 40 product teams — roughly 4,200 nodes, 118,000 pods, and around 340 active controllers/operators (Argo CD, Crossplane, cert-manager, external-secrets, a dozen custom operators, plus every product team's own reconcile loops). Three things converge in the same sprint:
- Between 10:00 and 11:30 local business hours,
apiserver_request_duration_secondsp99 for LIST calls onpodsandconfigmapsspikes from a baseline of ~180ms to 8-14 seconds.kubectl get pods -Atimes out from CI runners. The scheduler's informer cache falls behind, and pods sitPendingfor 30-90 seconds after a node has capacity. - A newly onboarded team's admission webhook (an image-policy validator) has no explicit timeout configured, defaults to 10 seconds, and during a dependency's brief outage, every
CREATE/UPDATEacross the entire cluster — not just that team's namespace — starts blocking for up to 10 seconds per request, because the webhook'snamespaceSelectorwas accidentally left unset and it matches everything. - On-call gets paged for
etcd_mvcc_db_total_size_in_bytesapproaching its 8GB quota. Investigation finds a controller with a bug in its reconcile loop is re-writing aConfigMapon every tick regardless of whether anything changed, generating a high-churn revision history that compaction and defrag aren't keeping ahead of.
The business ask, verbatim from the platform lead: "the control plane needs to stop being a shared point of failure that any one team's misbehaving controller or webhook can take down for everyone else, and it needs headroom to double in node count over the next year without a re-architecture." That is precisely the brief a control-plane scaling and isolation design has to answer — and precisely where teams that treat kube-apiserver as "the free thing Kubernetes gives you" run out of runway.
3. Production Architecture
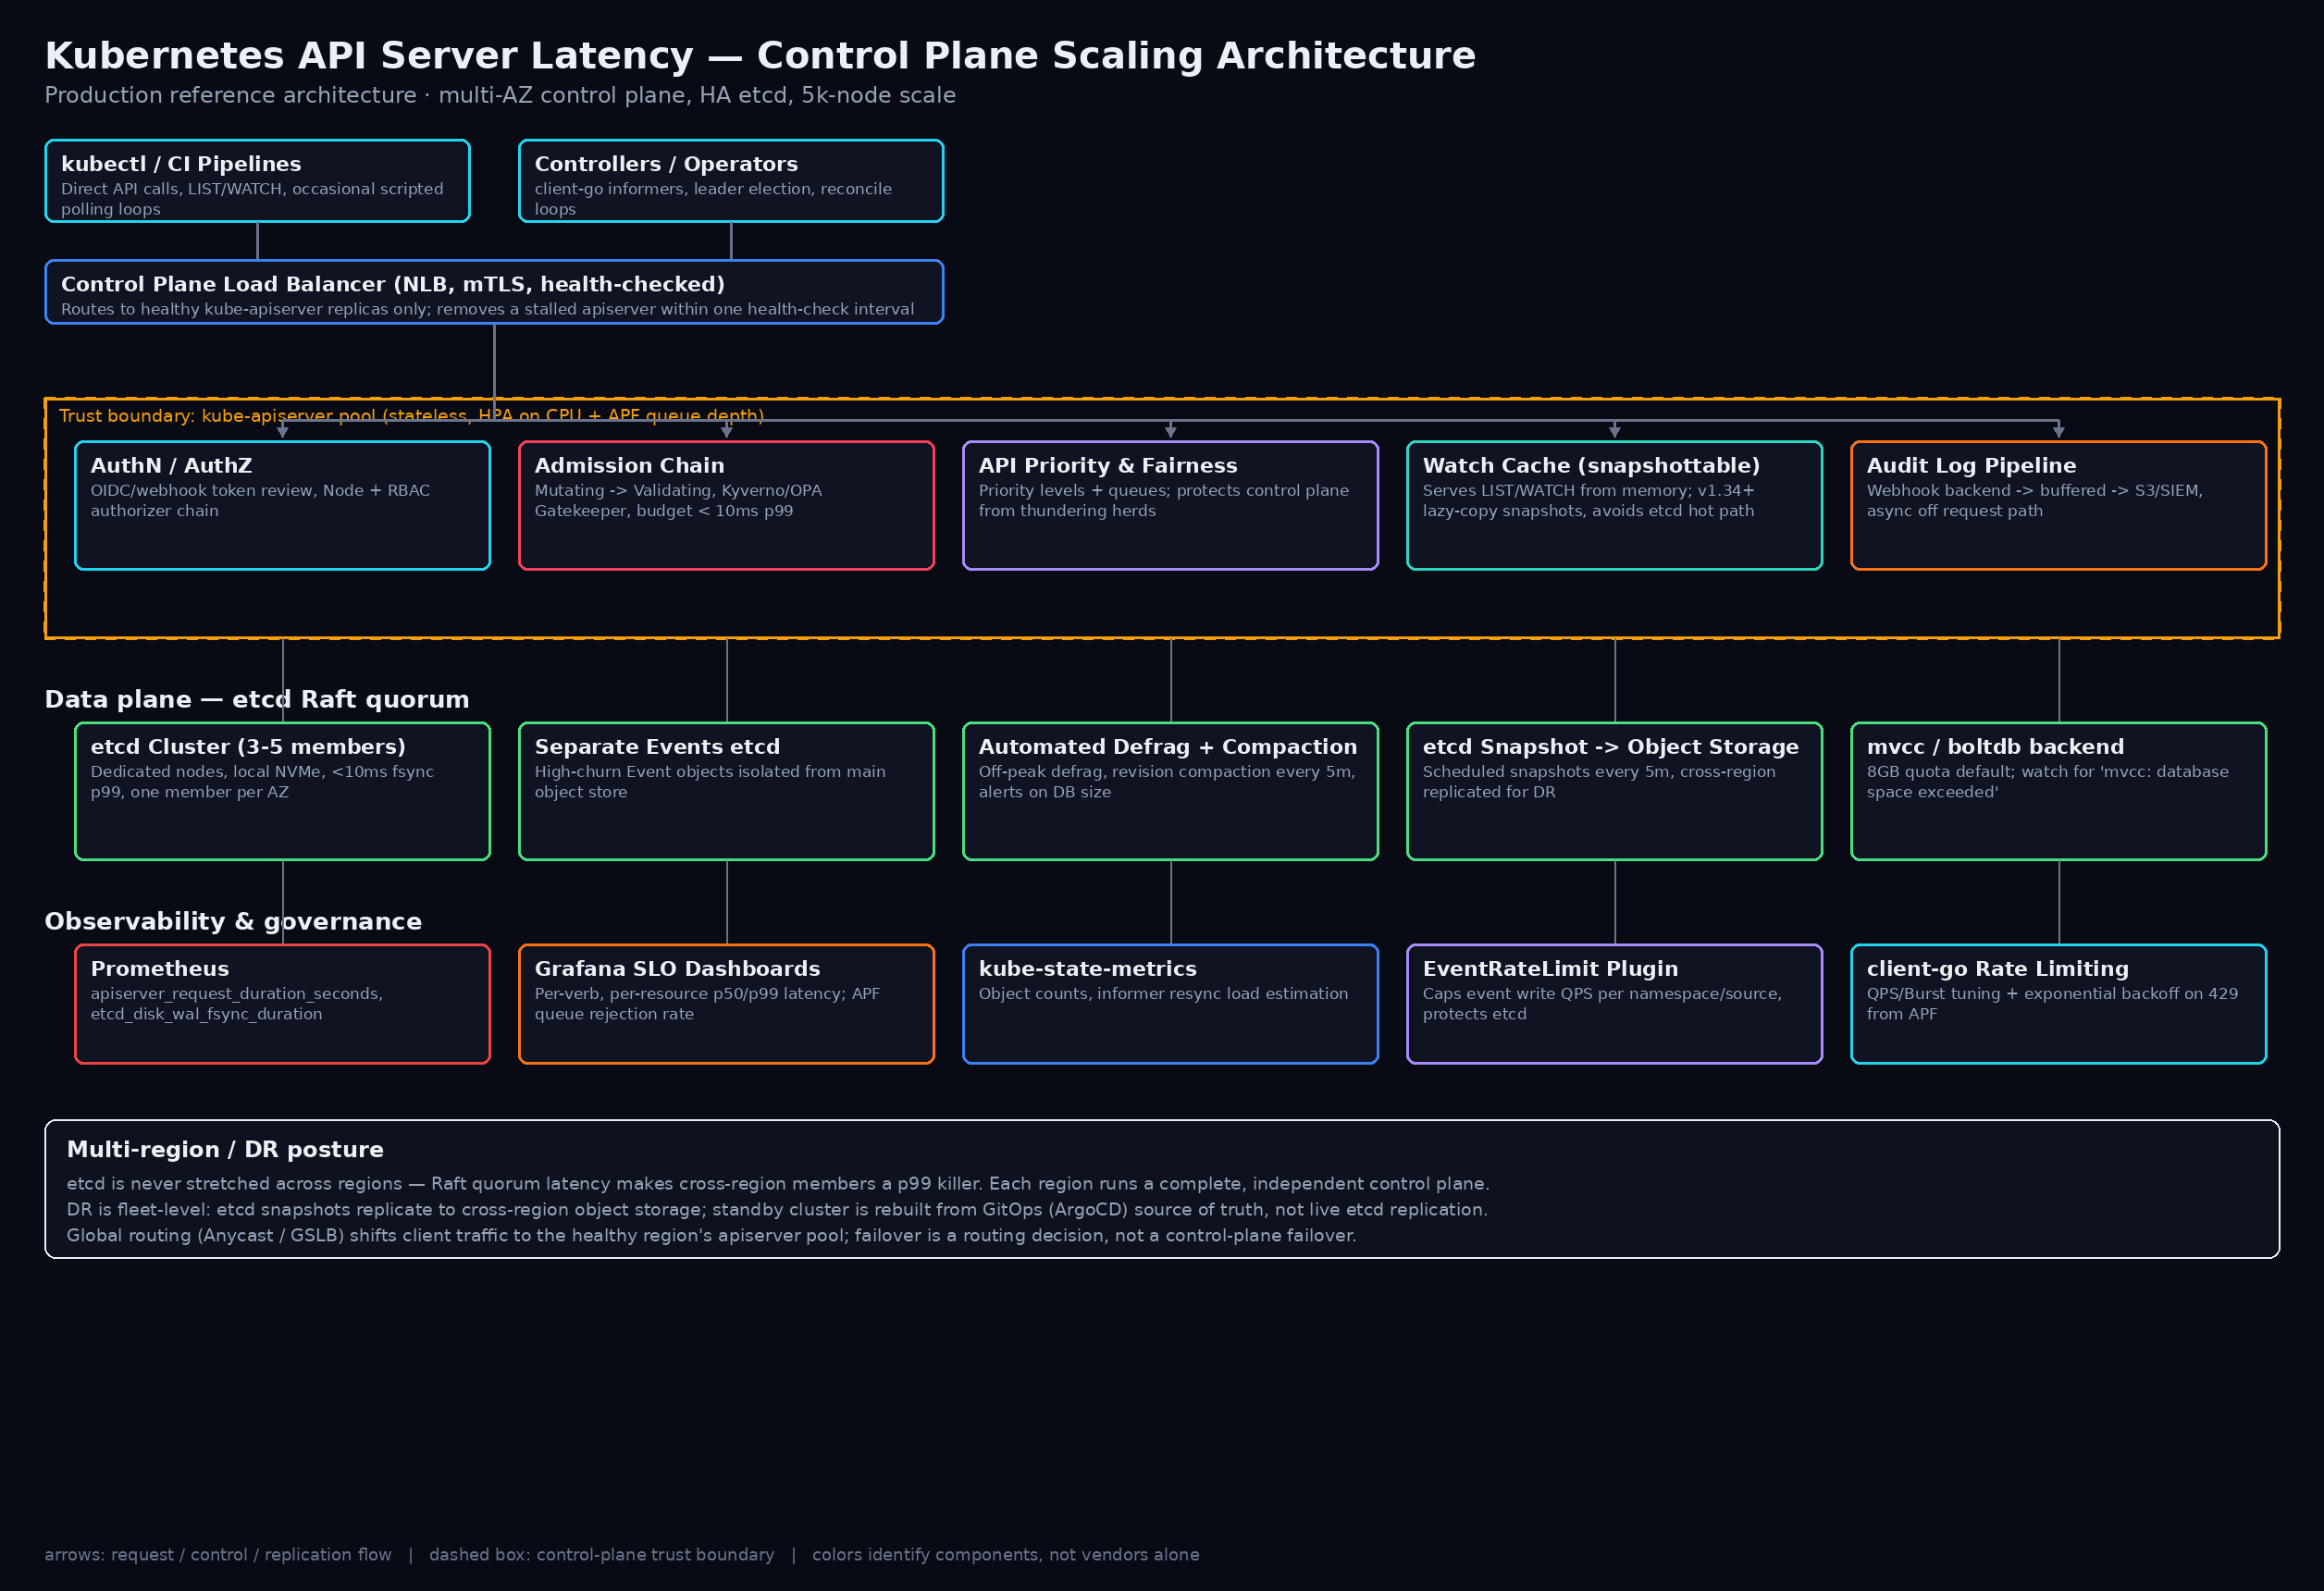
Client layer. Two request populations hit the control plane with very different characteristics: human/CI clients (kubectl, CI pipelines) doing bursty, often-unfiltered LIST calls, and controllers/operators built on client-go informers doing long-lived WATCH connections plus periodic full-resync LISTs (default resync period is informer-specific, commonly 0-10 hours, but many operators still default to 30s-10m, which under-scale badly). Both funnel through a control-plane load balancer — an internal NLB in front of the API server fleet, doing TLS passthrough or termination plus active health checks, so a wedged kube-apiserver replica is pulled out of rotation within one health-check interval rather than continuing to accept and time out requests.
kube-apiserver pool. The API servers themselves are stateless and horizontally scaled — this is the single most important architectural fact about the control plane: scale it out, not up, until etcd itself becomes the bottleneck. Each replica independently runs the full request pipeline: authentication (client-cert, OIDC token review, or webhook token auth), authorization (Node authorizer, RBAC, optionally webhook authorizer), the admission chain (mutating webhooks → object schema/CRD validation → validating webhooks), API Priority and Fairness (APF) queuing, and finally either a watch cache read (for most GET/LIST/WATCH) or a round-trip to etcd (writes, and cache-bypassing resourceVersion=0-avoiding strongly consistent reads).
API Priority and Fairness. APF is the mechanism that turns "one bad client" into "one throttled client" instead of "one incident." Requests are classified into priority levels (system, leader-election, workload-high, workload-low, global-default, plus custom FlowSchema/PriorityLevelConfiguration pairs) each with its own concurrency share and queue. A controller with a runaway resync loop exhausts its own priority level's queue and starts receiving 429 Too Many Requests with a Retry-After header — it does not consume concurrency slots that system-priority traffic (kubelet heartbeats, leader election) needs to keep the cluster alive.
Watch cache. As of Kubernetes 1.34, the watch cache is snapshottable (Beta): rather than the old model where a LIST-from-cache had to briefly lock the whole cache structure, each mutation now produces a lightweight, pointer-based lazy-copy snapshot, letting the API server serve nearly all read traffic directly from an in-memory, per-resource-type cache instead of round-tripping to etcd. Resilient watch cache initialization, stable in the same release, closes a related failure mode: previously, when many watch caches re-initialized simultaneously (API server restart, rolling upgrade), the flood of LIST/WATCH-from-etcd calls needed to rebuild every cache could itself overload etcd and starve APF. Now kube-apiserver bounds and staggers that rebuild traffic and returns 429 rather than let it cascade.
etcd cluster. A dedicated 3- or 5-member etcd cluster (odd member count for Raft quorum), one member per availability zone, on local NVMe with fsync latency budgeted under 10ms p99 — etcd's write path is fsync-bound, and a single slow disk degrades the whole quorum's commit latency. High-churn Event objects are split into a separate etcd cluster (--etcd-servers-overrides for the events.k8s.io group) so that a namespace generating thousands of events per minute cannot inflate compaction pressure or WAL growth for the primary object store that Deployments, Pods, and Secrets live in.
Security boundaries. Admission webhooks are scoped with explicit namespaceSelector/objectSelector, failurePolicy: Ignore where the webhook is non-critical, and a hard timeoutSeconds (1-5s, well under the API server's own request timeout) so that one team's external dependency cannot stall cluster-wide writes. RBAC and the Node authorizer bound what each identity can read/write; audit logging runs through an async, buffered webhook backend so audit overhead never sits on the synchronous request path.
HA/DR and multi-region. etcd is never stretched across regions — Raft's quorum-commit latency makes a cross-region member a permanent tax on every write, and a network partition risks a split-brain-adjacent stall. Instead, each region runs a complete, independent control plane; disaster recovery is fleet-level, not etcd-replication-level: etcd snapshots ship to cross-region object storage on a schedule, and a standby cluster is rebuilt from the GitOps source of truth (Argo CD) plus the latest snapshot, not from live etcd streaming replication. Global routing shifts client and workload traffic to the healthy region — failover is a routing decision at the edge, not a control-plane failover.
Why this shape, and how it evolves. Below a few hundred nodes, a single 3-node etcd cluster and 3 API server replicas with defaults is genuinely fine — the tuning in this session buys headroom that small clusters don't need and shouldn't pay the operational complexity for. The inflection point, consistent with every session this rotation, is when the coordination cost of shared infrastructure serving many independent teams' controllers exceeds the cost of deliberately engineering isolation (APF FlowSchemas, webhook timeouts, dedicated Events etcd) into the control plane. At 10x this scale (40,000+ nodes), the next axis to change is moving away from a single logical cluster altogether toward a fleet of smaller clusters behind a multi-cluster control plane (see Section 9) — API server horizontal scaling has a ceiling, because every replica still watches the same etcd, and etcd's own write throughput doesn't scale by adding more API server replicas in front of it.
4. Solution Design
Design decision: scale API servers horizontally, tune before you touch etcd. The API server tier is stateless and trivially horizontally scalable — that's the first lever, and it's nearly free. etcd is not: adding etcd members increases write latency (more peers to reach quorum with) even though it can improve read fan-out and fault tolerance. The correct order of operations under latency pressure is: (1) confirm API server replica count and resource requests are adequate and APF isn't misconfigured, (2) tune watch cache sizing and client request patterns (pagination, informer resync intervals, label/field selectors), (3) only then consider etcd-level changes (dedicated Events cluster, faster disks, defrag/compaction cadence) — and treat adding etcd members as a last resort, not a first response.
Alternative approaches considered and rejected.
- Vertically scaling a single API server instead of horizontal replicas. Works up to a point (bigger instance, more CPU for admission/serialization), but caps out because a single replica is still one failure domain and one CPU ceiling for the JSON/protobuf marshaling that dominates API server CPU time at scale. Horizontal scaling behind a health-checked LB is strictly better once you're past a handful of nodes.
- Letting every controller talk to a shared
PriorityLevelConfiguration(the defaultworkload-low). This is the out-of-the-box state and it is exactly the "one bad controller degrades everyone" failure mode from Section 2. Rejected in favor of explicitFlowSchemas per tenant/team so a misbehaving controller is throttled in isolation. - Splitting into more Kubernetes clusters instead of scaling the control plane. A legitimate strategy (see Section 9), but rejected as the first move here — it trades a control-plane scaling problem for a multi-cluster operations problem (federated RBAC, cross-cluster service discovery, N times the upgrade surface) and most teams hit control-plane limits well before genuine multi-cluster necessity (compliance boundaries, blast-radius requirements, true geographic distribution).
- Disabling audit logging or reducing RBAC granularity to cut request overhead. Rejected outright — the actual overhead of async, well-configured audit logging is marginal, and the security regression is not worth chasing single-digit-millisecond gains that tuning APF and watch cache sizing achieves far more safely.
Scalability considerations. The practical ceiling most teams hit isn't raw node count — Kubernetes has been validated well past 5,000 nodes — it's object churn rate and unfiltered watch/list fan-out. A cluster with 3,000 nodes and well-behaved controllers (proper label selectors, sane resync intervals, informers instead of polling) will out-perform a 1,000-node cluster with a dozen controllers doing unfiltered LIST on pods cluster-wide every 15 seconds.
Cost implications. API server and etcd compute is a rounding error next to GPU or even general compute spend, but incidents caused by control-plane latency are not — a 90-second scheduling delay across a large batch job queue, or a stuck deploy pipeline blocked on kubectl apply timeouts, has a real cost in engineering time and, for customer-facing autoscaling delay, potentially SLA-visible cost. Budget control-plane compute generously; it is cheap insurance.
Security implications. Every lever discussed here — APF isolation, webhook timeout/scoping discipline, RBAC minimization — is simultaneously a reliability control and a security control, because an under-scoped admission webhook or an over-privileged controller identity is both a latency risk and a blast-radius risk. Treat control-plane hardening as one review, not two.
Performance implications. The single highest-leverage client-side change most platforms can make is auditing controllers for unfiltered, unpaginated LIST calls and short resync intervals — this consistently outweighs server-side tuning in impact, because it addresses the source of load rather than the symptom.
5. Deep Technical Walkthrough
Request lifecycle, end to end. A kubectl get pods -n prod call: (1) TLS handshake and connection reuse (HTTP/2 multiplexing means most clients hold few long-lived connections); (2) authentication — client cert validation or a token review call for OIDC/webhook auth, which can itself be a network round-trip if the identity provider is slow; (3) authorization — Node authorizer check (does this identity have kubelet-scoped access), then RBAC evaluation walking ClusterRoleBinding/RoleBinding → Role/ClusterRole rules, short-circuiting on first allow; (4) admission for write requests only — mutating webhooks (in admissionregistration.k8s.io webhook-priority order), built-in admission plugins (ResourceQuota, LimitRanger, EventRateLimit), then validating webhooks, all synchronous and each contributing to end-to-end latency; (5) API Priority and Fairness — the request is classified into a FlowSchema, assigned a seat in its PriorityLevelConfiguration's queue, and either served immediately (concurrency available) or queued/rejected with 429; (6) read path: for a standard LIST, served from the watch cache (an in-memory, per-GroupVersionResource indexed store kept current via a persistent watch on etcd) rather than hitting etcd directly — this is the single biggest reason Kubernetes read-heavy workloads scale as well as they do; (7) response serialization (JSON or protobuf — protobuf is materially cheaper for internal client-go traffic) and return.
Control plane vs. data plane interaction. The scheduler and kube-controller-manager are themselves just API server clients running leader-election-gated singleton loops, watching resources through the same cache path as anyone else. This is why control-plane latency doesn't just slow kubectl — it slows scheduling decisions and reconciliation identically, because the scheduler's pod-binding write and its node/pod informer refresh both funnel through the same pipeline.
etcd's write path and why it's the real bottleneck for writes. Every write (CREATE/UPDATE/DELETE/PATCH) is a Raft proposal: the leader replicates the log entry to a quorum of followers, each of which must fsync it to disk before acknowledging, and only after quorum ack does the leader commit and apply to its MVCC (multi-version concurrency control) store. This is why etcd write latency is fundamentally disk-fsync-latency-bound and quorum-size-bound — it is not something you fix by adding more etcd members (that makes quorum slower, not faster) or by adding more API server replicas (they all still funnel writes to the same etcd leader).
Failure scenario: watch cache thundering herd on restart. Before 1.34's resilient watch cache initialization, a coordinated API server restart (rolling upgrade, or all replicas hitting an OOM near-simultaneously) meant every replica's watch cache for every resource type needed to re-LIST from etcd to rebuild, generating a burst of expensive LIST calls against etcd exactly when the control plane was least able to absorb it — a self-inflicted thundering herd. The fix bounds concurrent watch-cache-rebuild requests and rejects excess with 429 rather than let them queue unboundedly against etcd.
Failure scenario: admission webhook cascading stall. Covered in Section 2 — a single webhook without a tight timeoutSeconds and with an overly broad namespaceSelector converts its own dependency's outage into a cluster-wide write stall, because every write request blocks on that webhook's HTTP round-trip before it can proceed to the next admission stage.
Recovery mechanisms. APF's 429+Retry-After response is itself the primary recovery mechanism — it is designed so that well-behaved clients (client-go's default rate limiter honors it) back off automatically rather than the operator needing to intervene. For etcd-level distress (NOSPACE alarm from hitting the storage quota), the API server actively rejects writes cluster-wide until an operator runs etcdctl compact + defrag and clears the alarm — a deliberately conservative fail-safe that trades availability for data integrity.
6. Production Troubleshooting
Symptoms (matching Section 2's incident): kubectl timeouts, scheduler falling behind, apiserver_request_duration_seconds p99 spiking during business hours, etcd_mvcc_db_total_size_in_bytes climbing toward quota.
Step 1 — confirm where the latency lives. Query the API server's own latency histogram, broken down by verb and resource, to distinguish "everything is slow" from "one resource type is slow":
histogram_quantile(0.99,
  sum(rate(apiserver_request_duration_seconds_bucket{verb="LIST"}[5m]))
  by (le, resource))
If pods and configmaps LIST latency dominates while secrets and deployments stay flat, that points at either a specific high-churn resource or specific misbehaving clients rather than systemic control-plane exhaustion.
Step 2 — check APF rejection rate. A rising apiserver_flowcontrol_rejected_requests_total for a specific flow_schema label identifies the offending client population immediately — this is the fastest signal in the whole investigation, because it's pre-classified by the system that's already doing the isolation:
sum(rate(apiserver_flowcontrol_rejected_requests_total[5m])) by (flowSchema, reason)
Step 3 — identify the client. Cross-reference with audit logs (or apiserver_request_total broken down by user_agent — most controllers set an identifiable one) to find which service account or controller is generating the LIST volume:
kubectl logs -n kube-system -l component=kube-apiserver --tail=0 -f | \
  grep '"verb":"list"' | jq -r '.user.username' | sort | uniq -c | sort -rn | head -20
Or, cleaner, query pre-aggregated audit log data in your log backend (Loki/CloudWatch) for verb=list AND objectRef.resource=pods grouped by user.username over the incident window.
Step 4 — check etcd health directly. Disk fsync latency is the tell for etcd-side degradation:
histogram_quantile(0.99, rate(etcd_disk_wal_fsync_duration_seconds_bucket[5m]))
histogram_quantile(0.99, rate(etcd_disk_backend_commit_duration_seconds_bucket[5m]))
etcd_mvcc_db_total_size_in_bytes / etcd_server_quota_backend_bytes
fsync p99 comfortably under 10ms is healthy; anything climbing past 25-50ms under load is a disk (or noisy-neighbor, if on shared storage) problem, not a Kubernetes problem.
Step 5 — root cause and remediate. In this incident: the offending client was identified as a third-party operator's controller doing an unfiltered, unpaginated LIST pods across all namespaces every 15 seconds via a naive polling loop rather than an informer. Immediate mitigation was a FlowSchema pinning that service account to a dedicated, low-concurrency PriorityLevelConfiguration so it could no longer contend with workload-high traffic:
apiVersion: flowcontrol.apiserver.k8s.io/v1
kind: FlowSchema
metadata:
  name: throttle-noisy-operator
spec:
  priorityLevelConfiguration:
    name: workload-low
  matchingPrecedence: 100
  rules:
    - subjects:
        - kind: ServiceAccount
          serviceAccount:
            name: noisy-operator
            namespace: platform-ops
      resourceRules:
        - apiGroups: [""]
          resources: ["pods", "configmaps"]
          verbs: ["list", "watch"]
The durable fix (opened as a ticket against the operator's upstream, and mirrored internally with a patched image in the interim) was converting the polling loop to a proper client-go informer with label-selector-scoped watches. For the webhook cascading-stall issue, the remediation was adding timeoutSeconds: 3 and a correct namespaceSelector matching only the owning team's namespaces, plus failurePolicy: Ignore since the webhook's check was advisory rather than security-critical. For the etcd quota pressure, the buggy ConfigMap-rewriting controller was patched to only write on actual diff, and a CronJob running etcdctl defrag --cluster off-peak plus tightened --auto-compaction-retention was added as a standing guardrail.
Validation: post-fix, apiserver_request_duration_seconds p99 for LIST on pods returned to ~150-220ms even during business-hours peak, APF rejections for the throttled flow schema confirmed the isolation was working as intended (rejecting the noisy client, not legitimate traffic), and etcd_mvcc_db_total_size_in_bytes stabilized well under quota.
7. Hands-on Lab
Goal: reproduce APF isolation and watch cache behavior on a local cluster, then observe the metrics that would drive the troubleshooting flow above.
Setup (kind, single control-plane node with APF metrics exposed):
cat <<'EOF' > kind-config.yaml
kind: Cluster
apiVersion: kind.x-k8s.io/v1alpha4
nodes:
  - role: control-plane
    kubeadmConfigPatches:
      - |
        kind: ClusterConfiguration
        apiServer:
          extraArgs:
            feature-gates: "WatchListClient=true"
            audit-log-path: "-"
EOF
kind create cluster --name apf-lab --config kind-config.yaml
1. Inspect the default FlowSchemas and PriorityLevelConfigurations:
kubectl get flowschemas
kubectl get prioritylevelconfigurations
kubectl describe prioritylevelconfiguration workload-low
2. Generate synthetic LIST load to trigger APF queuing:
cat <<'EOF' > hammer.sh
#!/bin/bash
for i in $(seq 1 50); do
  (kubectl get pods -A --raw='/api/v1/pods' > /dev/null &)
done
wait
EOF
chmod +x hammer.sh && ./hammer.sh
3. Watch APF metrics during the load:
kubectl get --raw /metrics | grep apiserver_flowcontrol_rejected_requests_total
kubectl get --raw /metrics | grep apiserver_flowcontrol_current_inqueue_requests
4. Create an isolating FlowSchema for a test service account and confirm rejection isolation:
kubectl create serviceaccount noisy-client
kubectl apply -f - <<'EOF'
apiVersion: flowcontrol.apiserver.k8s.io/v1
kind: FlowSchema
metadata:
  name: lab-throttle-noisy
spec:
  priorityLevelConfiguration:
    name: workload-low
  matchingPrecedence: 100
  rules:
    - subjects:
        - kind: ServiceAccount
          serviceAccount: { name: noisy-client, namespace: default }
      resourceRules:
        - apiGroups: [""]
          resources: ["pods"]
          verbs: ["list", "watch"]
EOF
5. Inspect watch cache sizing and etcd object counts:
kubectl get --raw /metrics | grep apiserver_watch_cache_capacity
kubectl get --raw /metrics | grep -E "etcd_object_counts|apiserver_storage_objects"
Validation: confirm apiserver_flowcontrol_current_inqueue_requests{priority_level="workload-low"} rises during the hammer script and that a FlowSchema-scoped subject shows up isolated in apiserver_flowcontrol_request_concurrency_limit without affecting workload-high metrics.
Cleanup:
kind delete cluster --name apf-lab
rm -f kind-config.yaml hammer.sh
8. Production Case Study
Google (GKE / Borg lineage). Google's internal experience running Borgmaster (Kubernetes's architectural ancestor) at extreme scale directly informed API Priority and Fairness's design — the core insight that a shared control plane needs fairness between tenants, not just raw throughput, traces back to Borg's admission-and-scheduling isolation lessons. GKE's Autopilot and large-cluster SREs lean heavily on horizontally scaled, regionally distributed control planes with strict per-tenant quota and webhook governance as a first-class SRE discipline, not an afterthought.
Netflix. Netflix's platform team has published on running very large numbers of small-to-medium EKS clusters rather than fewer giant ones specifically to bound control-plane blast radius — accepting the multi-cluster operational overhead described in Section 4 as a deliberate trade against the "one shared control plane, one shared failure domain" risk profile, particularly for tenant isolation between internal teams with very different traffic and controller-quality profiles.
Amazon (EKS). AWS's introduction of advanced control plane configuration for EKS — including tunable etcd event retention and exposed control-plane metrics — reflects direct customer pain from exactly this session's incident pattern: high-churn Event objects and unbounded informer resync traffic degrading shared control planes at fleet scale, pushing AWS to expose knobs previously hidden inside the managed control plane.
OpenAI / large-scale GPU training platforms. Training platforms running gang-scheduled, multi-thousand-pod distributed jobs (the workload pattern Kubernetes 1.37's gang-scheduling Beta directly targets) have converged on the same architectural answer independently: dedicated, isolated control planes per training cluster rather than sharing a control plane between training and general-purpose workloads, precisely because a training job's pod churn during scale-up/scale-down is bursty enough to threaten shared-tenant fairness even with APF in place.
9. Architecture Review
Strengths. Horizontal API server scaling behind a health-checked LB is cheap, stateless, and well-understood; APF gives real per-tenant isolation without requiring cluster splitting; the snapshottable watch cache and resilient watch cache initialization (both landing in 1.34, hardened further in 1.37) directly close two of the most common real-world incident classes described here; separating the Events etcd cluster is a low-effort, high-leverage isolation win.
Weaknesses. The design still shares a single etcd cluster (minus Events) across all tenants — a sufficiently pathological write-heavy tenant (not just read-heavy, which APF handles well) can still degrade write latency for everyone, because APF governs concurrency and queuing at the API server, not etcd's underlying Raft commit throughput. Webhook governance depends on every team correctly setting timeoutSeconds and scoping selectors — that's a policy/review problem, not something the architecture enforces structurally, and it's the weakest link in this design (Kyverno/OPA policies that require webhook timeout and selector fields on webhook configuration objects themselves close some of this gap).
What fails first at 10x scale. At roughly 40,000+ nodes, etcd's single-writer-quorum model becomes the hard ceiling regardless of how well-tuned the API server tier is — no amount of API server horizontal scaling increases etcd's Raft commit throughput, because they all still serialize through the same leader. This is the point where the architecture must evolve toward either (a) a fleet of smaller, independently-quorumed clusters behind a multi-cluster control plane (Cluster API, Karmada, or a custom fleet controller), or (b) aggressive object-count reduction (moving high-cardinality custom resources out of core etcd into an aggregated API server backed by a purpose-built store) — both are real production patterns, not theoretical.
What changes for 100 million users (interpreting as: a platform whose control-plane load is driven by end-user-triggered workload creation, e.g., a multi-tenant SaaS provisioning a Kubernetes resource per user action). The single-cluster-with-isolation model in this session does not extend to that scale — the answer becomes cell-based architecture: many independent, smaller Kubernetes clusters (each a blast-radius-bounded "cell") behind a control plane that itself is not Kubernetes-API-shaped but a purpose-built fleet orchestrator, with per-cell control planes sized for a bounded, predictable tenant count rather than one control plane absorbing unbounded growth.
What would I redesign, knowing what I know now. I would push admission webhook governance into policy-as-code from day one (Kyverno ValidatingPolicy enforcing timeoutSeconds and namespaceSelector presence on every ValidatingWebhookConfiguration/MutatingWebhookConfiguration at admission time) rather than relying on code review catching it — that single control would have prevented the Section 2 cascading-stall incident structurally rather than reactively.
10. Best Practices
Reliability. Run at least 3 API server replicas across failure domains behind an actively health-checked LB; set explicit, tight timeoutSeconds on every admission webhook and scope namespaceSelector/objectSelector as narrowly as the use case allows; use failurePolicy: Ignore for non-security-critical webhooks.
Scalability. Prefer horizontal API server scaling over vertical; keep etcd member count at 3 or 5 (never even numbers); split high-churn Events into a dedicated etcd cluster; audit controllers for unfiltered LIST calls and short resync intervals as a standing practice, not a one-time cleanup.
Observability. Alert on apiserver_request_duration_seconds p99 per verb/resource, apiserver_flowcontrol_rejected_requests_total by flow schema, etcd_disk_wal_fsync_duration_seconds p99, and etcd_mvcc_db_total_size_in_bytes as a fraction of quota — these four signals cover the large majority of real-world control-plane incidents.
Security. Treat webhook timeout/scoping and RBAC minimization as a single review discipline; require policy-as-code enforcement (Kyverno/OPA) on webhook configuration objects themselves so a misconfiguration can't ship silently.
Cost Optimization. Control-plane compute is cheap relative to the workloads it schedules — don't under-provision API server or etcd resources to save a marginal amount; the cost of an incident dwarfs the savings.
Performance. Use protobuf content-type for internal client-go traffic (the default for in-cluster clients), paginate large LIST calls (limit/continue), and prefer informers with label/field selectors over ad hoc polling.
Maintainability. Define per-tenant FlowSchemas explicitly rather than relying on the default catch-all workload-low/workload-high split once you have more than a handful of distinct controller populations sharing the cluster.
Operational Excellence. Rehearse etcd snapshot restore and control-plane rebuild-from-GitOps as a regular DR drill, not a document that's never been executed.
11. Common Production Mistakes
Running admission webhooks without an explicit timeoutSeconds (silently defaulting to 10s) and without a scoped namespaceSelector — the single most common cause of "unrelated team's dependency outage becomes cluster-wide write stall" incidents. Treating etcd like a general-purpose database and storing large objects (embedded certs, large ConfigMaps used as ad hoc key-value stores) in it, inflating object size and compaction cost. Letting controllers poll with kubectl-style unfiltered LIST calls on a timer instead of using client-go informers with proper resync tuning. Adding etcd members to "improve performance" when the actual bottleneck is write throughput, which quorum expansion makes worse, not better. Ignoring apiserver_flowcontrol_rejected_requests_total until an incident, rather than watching it as a leading indicator that a specific tenant is approaching its isolation boundary. Never load-testing admission webhook latency under realistic concurrent load before it goes into the cluster-wide chain.
12. Interview Preparation
Q: Why does adding more etcd members not improve write latency, and when would you add them anyway? A: Every write requires quorum commit — the leader must get acknowledgment (including fsync) from a majority of members before committing. More members means a larger majority to reach, which increases, not decreases, write latency. You'd add members anyway purely for fault tolerance (surviving more simultaneous member failures) or to spread read load across more followers for stale/serializable reads, never to improve write throughput.
Q: Walk through what happens when a FlowSchema's priority level is fully saturated. A: New requests matching that flow schema are queued up to the queueLengthLimit; once the queue is also full, the API server rejects with HTTP 429 and a Retry-After header. Well-behaved clients (client-go's rate limiter) back off automatically. Critically, this isolation means a saturated workload-low priority level does not consume concurrency seats reserved for system or leader-election priority levels — that's the entire point of APF.
Q: How does the watch cache keep itself consistent with etcd, and what's the risk during a cache rebuild? A: The API server holds a persistent watch on etcd per resource type and applies every event to its in-memory cache in order, tracked by resourceVersion. On startup or cache invalidation, it must first LIST the full current state from etcd before it can start applying the watch stream consistently — that LIST-then-watch rebuild is expensive at scale, which is exactly what resilient watch cache initialization (stable in 1.34) bounds and staggers to prevent a thundering herd against etcd.
Q: A customer reports intermittent 30-second pod scheduling delays. Where do you look first, and why? A: apiserver_request_duration_seconds for the scheduler's own traffic pattern (its informer LIST/WATCH on nodes and pods, and its bind POST calls) and APF rejection metrics for the scheduler's flow schema first — because scheduling delay under control-plane pressure is almost always the scheduler's own API calls being queued or slowed, not a scheduling-algorithm problem. Only after ruling out control-plane latency would I look at scheduler predicates/filters, resource fragmentation, or PodDisruptionBudget contention.
Q: Design a control plane isolation strategy for a shared cluster with both a latency-sensitive production tenant and a bursty batch-training tenant. A: Give the batch tenant its own FlowSchema/PriorityLevelConfiguration with a bounded concurrency share so its burst LIST/WATCH traffic during job scale-up/scale-down cannot contend with the production tenant's workload-high traffic; consider a dedicated node pool and even a dedicated etcd Events split if the batch tenant is pod-churn-heavy; if the batch tenant's scale (gang-scheduled jobs with thousands of pods) is large enough, evaluate whether it warrants its own control plane entirely rather than sharing.
Q: What's the operational difference between scaling API server replicas and scaling etcd members, and why does that distinction matter for on-call decision-making? A: API server replicas are stateless — adding one is a safe, fast, reversible action you can take mid-incident. etcd membership changes are stateful, quorum-affecting operations that carry real risk (a botched member add/remove can threaten quorum) and should never be an in-incident reflex; they're a planned, tested change.
13. Latest Industry Updates
Kubernetes v1.37 "Garhwal" (released August 26, 2026). 67 enhancements — 16 graduating to Stable, 23 to Beta, 27 entering Alpha. Directly relevant to this session: resilient watch cache initialization reached Stable, closing the thundering-herd-on-restart failure mode discussed in Section 6. Dynamic Resource Allocation's core also reached Stable, with four more DRA enhancements graduating — significant for GPU/HPC control-plane load, since DRA claims and allocations are themselves API-server-mediated objects whose churn matters at scale. Gang scheduling reached Beta, directly addressing distributed AI training deadlocks, and HPA scale-to-zero reached Beta and is enabled by default — both increase control-plane churn precisely in the AI workload pattern described in Section 1, making the isolation techniques in this session more relevant, not less. The release also continues the shift away from legacy kube-dns and IPVS proxy mode toward nftables, and introduces pod-level checkpoint/restore as Alpha. Kubernetes v1.37: Garhwal, Network World coverage
Kubernetes v1.34 — Snapshottable API Server Cache (Beta) and Resilient Watch Cache Initialization (Stable). The foundation this session's watch-cache discussion builds on: per-mutation lazy-copy snapshots let nearly all read traffic serve from memory, and startup readiness protection prevents watch-cache reinitialization from overloading etcd or exhausting APF capacity. Kubernetes v1.34: Snapshottable API server cache
AWS EKS — Advanced Control Plane Configuration. AWS shipped tunable etcd event retention and exposed control-plane metrics for EKS, a direct response to the "shared control plane degraded by high-churn Event objects and unbounded informer traffic" pattern this session covers — previously a fully opaque, black-box part of the managed offering. AWS: Advanced Kubernetes control plane configuration in EKS
Why these matter operationally. Every one of these updates reduces the amount of custom tooling platform teams previously had to hand-roll to get this session's isolation guarantees — resilient watch cache init used to require operational discipline around staggered rolling restarts; now it's a control-plane guarantee. That's the general trend worth tracking: capabilities that used to be "senior platform engineer tribal knowledge" are steadily becoming upstream defaults, which changes what's worth building in-house versus what to simply upgrade for.
14. Summary & Cheat Sheet
Key concepts: the API server is stateless and horizontally scalable; etcd is the stateful, quorum-bound bottleneck and should be the last thing you scale, not the first; API Priority and Fairness provides per-tenant isolation at the request-queuing layer; the watch cache is what makes read-heavy Kubernetes workloads viable at scale, and its snapshottable (1.34+) and resilient-initialization (1.34+, hardened in 1.37) properties close the two most common real-world failure modes.
Architecture pattern: LB → stateless API server pool (AuthN → AuthZ → Admission → APF → watch cache/etcd) → dedicated etcd cluster (Events split out) → GitOps-driven, snapshot-based DR, never cross-region-stretched etcd.
Troubleshooting checklist:
apiserver_request_duration_secondsp99 by verb/resource — where does the latency live?apiserver_flowcontrol_rejected_requests_totalby flow schema — which tenant is saturated?- Audit logs by
user.username— which client is generating the load? etcd_disk_wal_fsync_duration_seconds/etcd_disk_backend_commit_duration_seconds— is etcd itself degraded?etcd_mvcc_db_total_size_in_bytesvs. quota — is compaction/defrag keeping up?
Design patterns: explicit FlowSchemas per tenant rather than the default catch-all; hard timeoutSeconds and scoped selectors on every admission webhook, enforced via policy-as-code; dedicated Events etcd cluster; horizontal API server scaling before any etcd-level change; cell-based multi-cluster architecture as the answer past the point where a single etcd's write throughput becomes the ceiling.
Best-practice commands:
kubectl get flowschemas
kubectl get prioritylevelconfigurations
kubectl get --raw /metrics | grep apiserver_flowcontrol_rejected_requests_total
etcdctl endpoint status --cluster -w table
etcdctl defrag --cluster