
GPU Node Exhaustion: Multi-Tenant GPU Scheduling with DRA, MIG, Time-Slicing, and KAI Scheduler
Daily DevOps Mentor — 2026-08-27
1. Topic of the Day
GPU scheduling on Kubernetes exists because the default scheduler was built for a world of fungible, integer-divisible CPU and memory — and a GPU is neither fungible nor integer-divisible in any way that matters to a tenant. kube-scheduler's device-plugin model (the one shipped since 1.8) treats an accelerator as an opaque nvidia.com/gpu: 1 resource: allocatable count in, allocatable count out, no notion of which GPU, what generation, how much HBM, whether it's NVLink-connected to its neighbor, or whether it's already fractionally claimed. That was tolerable when clusters ran one model per node. It stopped being tolerable the moment platform teams had to fit a $40K H100 node with 80GB HBM per card behind dozens of tenants — some needing a sliver for a 7B quantized model, some needing the whole card for a training job, some needing eight cards NVLink-bonded for tensor-parallel inference of a 400B+ MoE model.
Three technologies now sit on top of (or replace) the legacy device-plugin model, and a senior platform engineer needs to know when each applies:
- NVIDIA GPU Operator — the day-2 operator that installs and lifecycle-manages the driver, container toolkit, device plugin, DCGM exporter, MIG manager, and (as of the 26.x line) the DRA driver for GPUs, entirely in-cluster via
ClusterPolicy/NVIDIADriverCRDs instead of baking drivers into node AMIs. - Dynamic Resource Allocation (DRA) — the
resource.k8s.ioAPI group that replaced "give me a count" with "give me a device matching these attributes." DRA core went GA in Kubernetes 1.34 and is stable and enabled by default in 1.35. NVIDIA donated its DRA driver to CNCF at KubeCon EU 2026, which is the signal that this is no longer a vendor side-project — it's becoming the standard GPU scheduling substrate. - KAI Scheduler — the GPU-aware batch scheduler NVIDIA extracted from its Run:ai acquisition and open-sourced under Apache 2.0 in 2025. It replaces
kube-scheduler's bin-packing with gang scheduling, fractional GPU sharing, workload consolidation/defragmentation, and fairness-aware preemption/reclaim — the primitives every ML platform team used to hand-roll withPriorityClasshacks and cron-based bin-packers.
In enterprise production this stack shows up as the difference between a GPU fleet running at 30-40% utilization (the industry-typical waste number platform teams inherit from naive Deployment + nvidia.com/gpu: 1 scheduling) and one running at 70-85% through MIG partitioning, time-slicing, and DRA-based topology-aware placement. At the scale of Amazon, Microsoft, Google, Uber, OpenAI, Anthropic, and NVIDIA itself, a 40-point utilization gap on a GPU fleet is not a rounding error — it is tens to hundreds of millions of dollars a year, which is exactly why this layer of the stack has had more investment in the last 18 months than almost any other part of Kubernetes.
Today's session covers the layer above "install the device plugin and hope": how you design a multi-tenant GPU platform that survives GPU node exhaustion, how DRA and MIG interact, when KAI Scheduler earns its complexity, and how to debug a cluster where GPUs show Allocatable but pods sit Pending anyway.
2. Real Business Problem
Symptom: Your platform runs a shared GPU cluster (mixed H100/A100 node pools on EKS) serving three tenant classes off one capacity pool: a real-time inference team running quantized 7B–13B models behind vLLM, a research team running ad-hoc fine-tuning jobs, and a batch-embeddings team running large nightly jobs. At 14:00 UTC on a Tuesday:
- The inference team's HPA fires to scale a vLLM
Deploymentfrom 12 to 20 replicas in response to a traffic spike. Eight pods sitPendingwith0/47 nodes are available: 47 Insufficient nvidia.com/gpu. kubectl get nodes -o json | jq '.items[].status.allocatable."nvidia.com/gpu"'shows plenty of GPUs still "allocatable" cluster-wide — but they're fragmented: 40 GPUs are sitting at 15-20% SM utilization each, fully claimed by whole-GPU requests from research notebooks that only need a fraction of a card.- Cluster Autoscaler (or Karpenter) should be adding capacity, but the GPU node group is pinned at its max size because finance capped H100 spend last sprint, and nobody wired that cap into a signal the scheduler or HPA can see.
- DCGM Exporter metrics (when anyone bothers to look) show
DCGM_FI_DEV_GPU_UTILin the 15-25% range fleet-wide, next to aPendinginference pod that would run fine on the unused capacity inside GPUs that are already allocated to someone else.
This is a compressed version of the "GPU node exhaustion" scenario named directly in the task brief, and it's the single most expensive failure mode I see in AI platform reviews. The root cause is never "not enough GPUs" — it's allocation granularity: the legacy device-plugin model can only hand out whole GPUs, so a cluster can be simultaneously GPU-exhausted (nothing schedulable) and GPU-underutilized (nothing actually computing). Fixing it requires attacking three layers at once: fractional sharing (MIG/time-slicing/MPS) so requests match actual need, a scheduler that understands fractions and topology (KAI or a DRA-aware scheduler), and capacity signals that autoscaling can actually act on.
3. Production Architecture
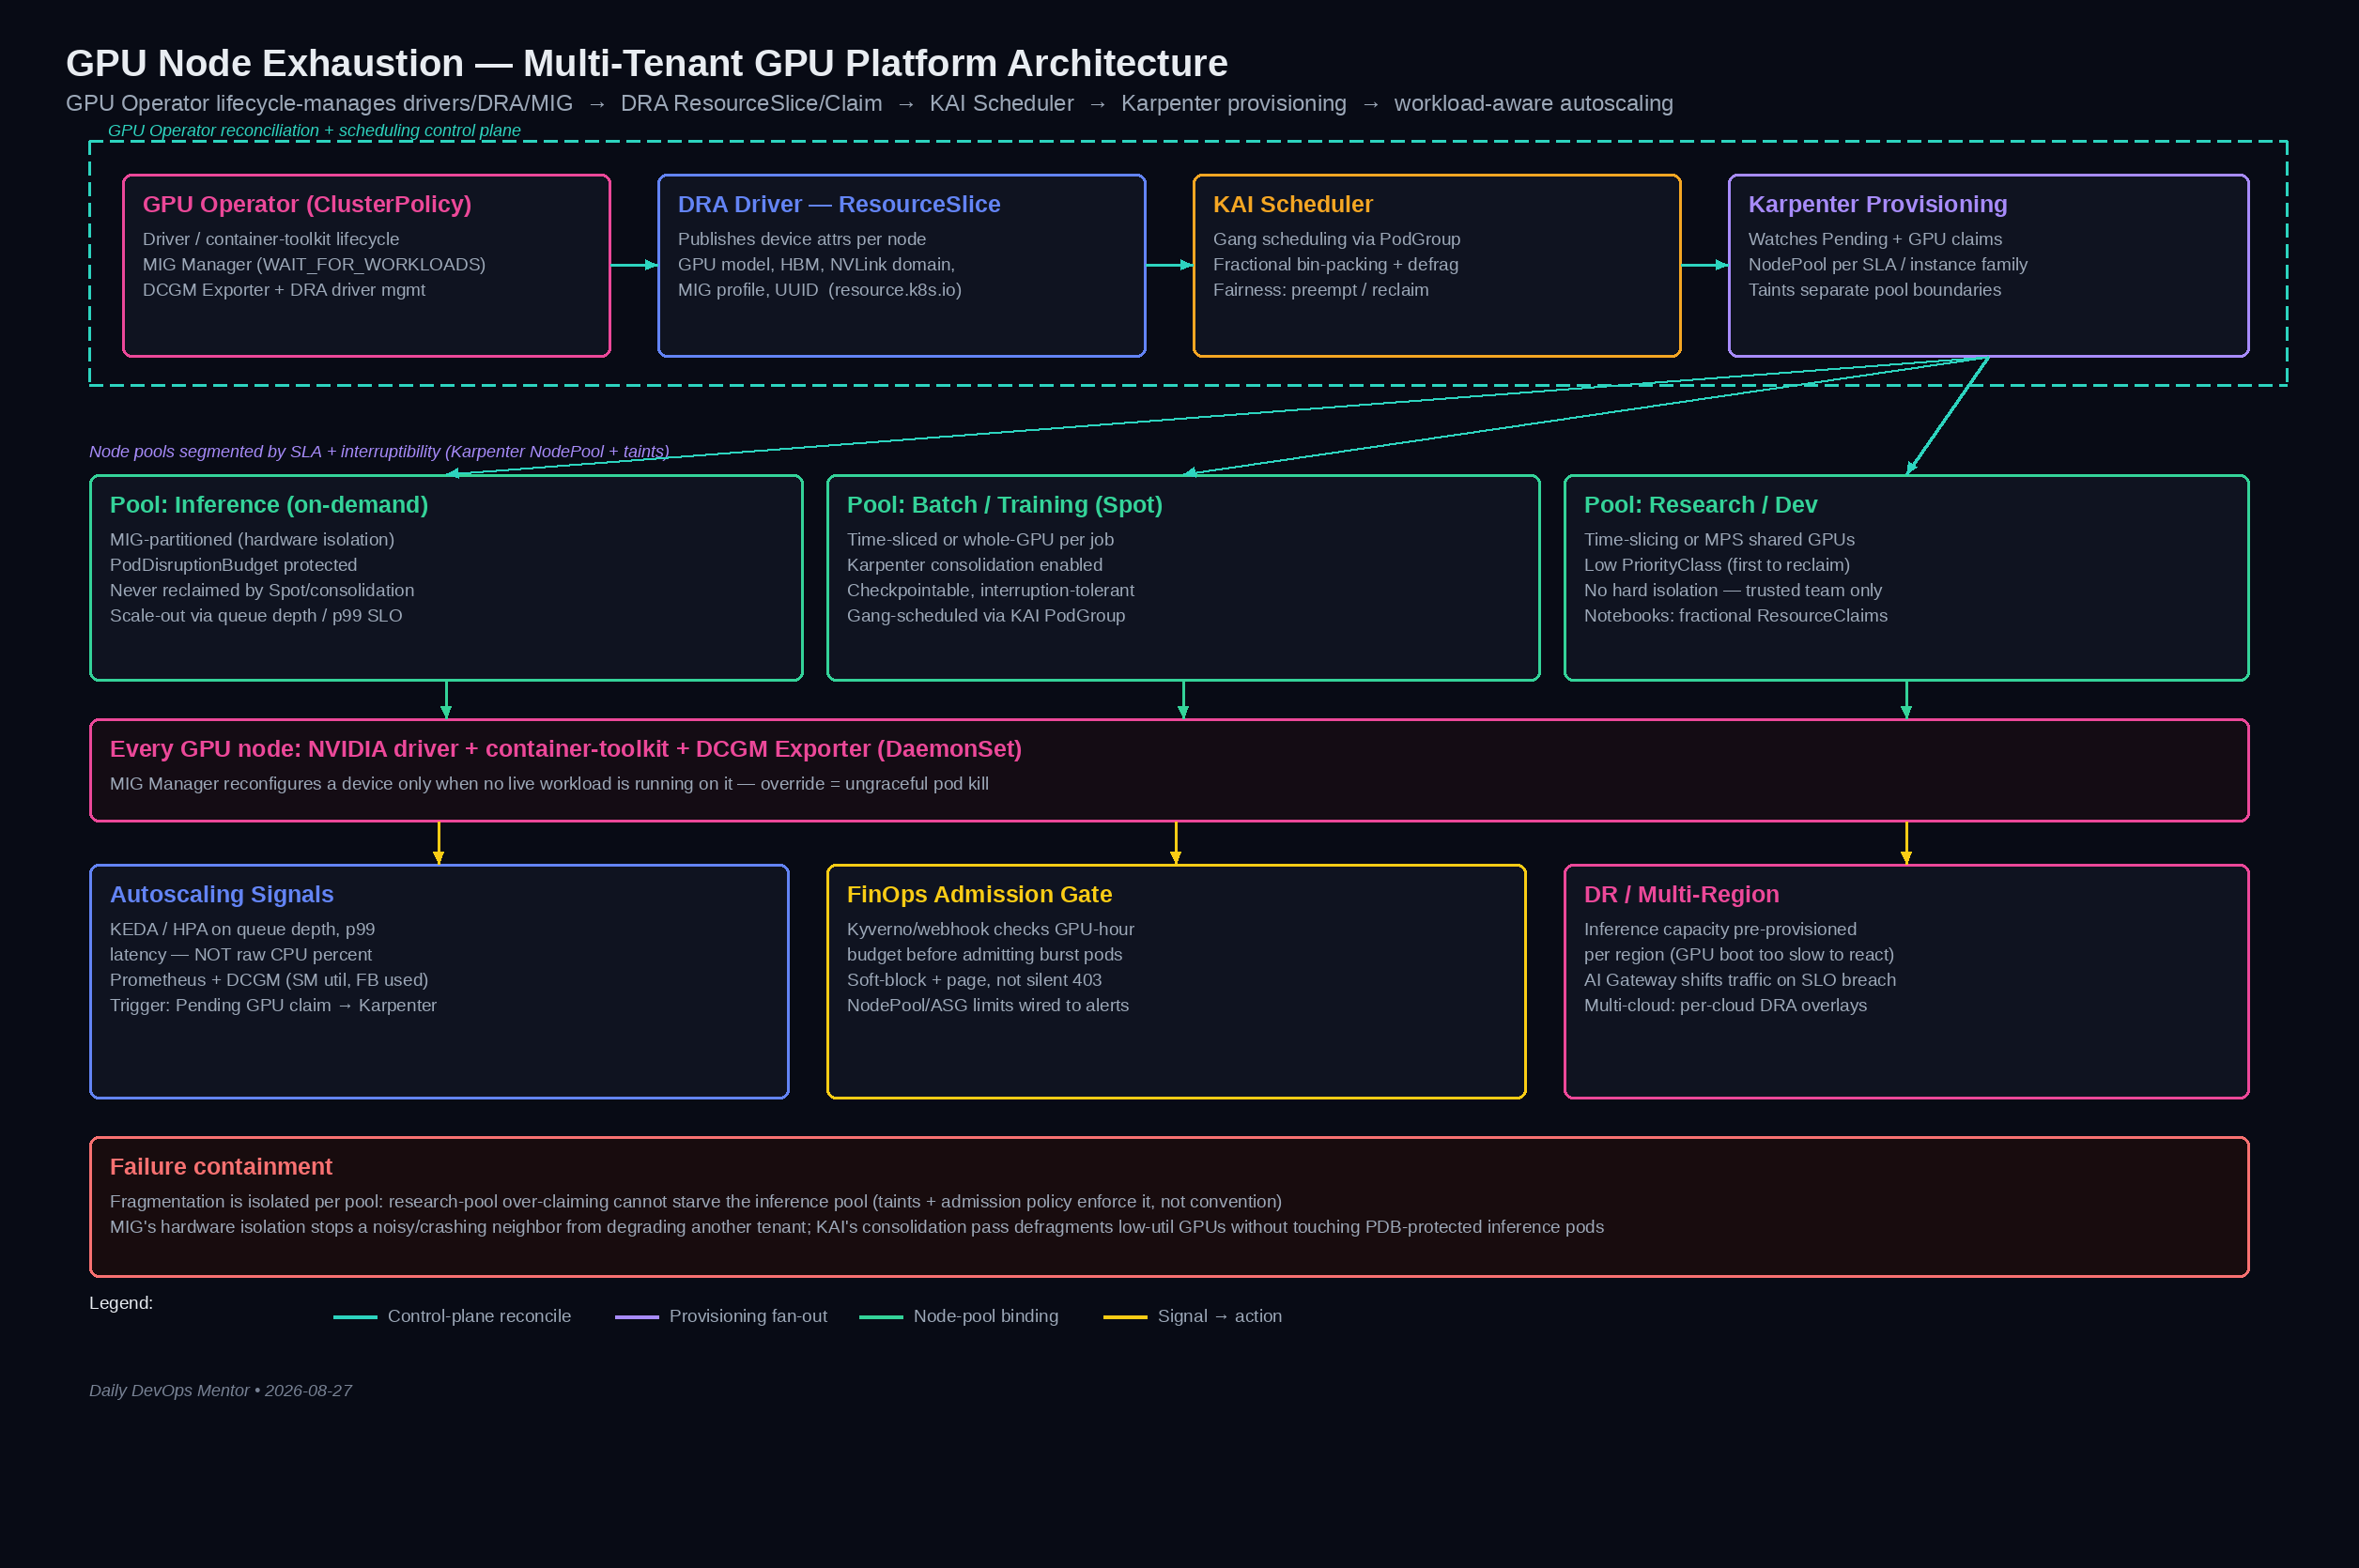
Node pool segmentation. Don't run one undifferentiated GPU node pool. Segment by workload SLA and interruptibility: an on-demand inference pool (H100/A100, MIG-partitioned, PodDisruptionBudget-protected, never touched by Spot reclaim), a Spot/interruptible batch pool (training, embeddings, checkpointable jobs, tolerating Karpenter-driven consolidation and Spot interruption via the two-minute AWS notice), and a research/dev pool (time-sliced or MPS-shared, lower priority class, subject to preemption). This mirrors how Karpenter is used elsewhere in the fleet for general compute — the difference is GPU NodePool requirements pin karpenter.k8s.aws/instance-gpu-count and node.kubernetes.io/instance-type so provisioning targets the exact SKUs (H100 SXM for NVLink-dependent multi-GPU inference, A100 PCIe for single-GPU-fraction workloads) instead of letting Karpenter pick the cheapest match, which for GPU workloads is frequently the wrong instance family.
Component interactions and data flow.
- NVIDIA GPU Operator (
ClusterPolicyCR) reconciles every GPU node: driver container (or host driver viaNVIDIADriverCR for immutable AMIs),nvidia-container-toolkit, the legacy device plugin or the DRA driver for GPUs (mutually configurable per node pool), the MIG Manager (applies MIG profiles per aConfigMap-driven policy, e.g.,all-1g.10gbfor the research pool), and DCGM Exporter (per-GPU Prometheus metrics with Kubernetes pod-metadata enrichment). - DRA driver publishes a
ResourceSliceper node describing every physical/MIG-sliced device with typed attributes: GPU model, HBM capacity, NVLink domain, MIG profile, driver/CUDA version, and UUID. Workloads submit aResourceClaim(or a template referenced from a pod spec) expressing requirements via CEL selectors — "an H100 with ≥40GB free and NVLink to a matching peer" — instead of a bare integer count. - KAI Scheduler (replacing or running alongside
kube-schedulervia scheduler-name selection) consumes both classicnvidia.com/gpurequests and DRAResourceClaims. It runs a podgroup-aware gang scheduling pass for distributed training jobs (all-or-nothing placement so you never half-launch a tensor-parallel job), applies fractional-GPU bin-packing for inference pods, and periodically runs a consolidation pass that live-migrates or reschedules low-priority pods to defragment partially-used GPUs — directly attacking the fragmentation failure mode from Section 2. - Karpenter watches for
Pendingpods carrying unsatisfiable GPU requests/claims and provisions new nodes from the correctNodePool/EC2NodeClass, respectingtaintsthat keep general workloads off (and inference workloads on) GPU-tainted nodes. Karpenter's consolidation is explicitly disabled or heavily constrained on the inference pool (you don't want mid-day node churn under an SLA) and enabled aggressively on the Spot/batch pool. - Autoscaling signal loop: KEDA (or HPA against custom metrics) scales vLLM/Triton deployments off queue depth and p99 latency from Prometheus, not raw CPU — GPU inference is rarely CPU-bound, so CPU-based HPA is close to useless here. Scale-out events become
Pendingpods with GPU claims, which is the trigger Karpenter watches. - Cost/budget gate: a FinOps-owned admission webhook (Kyverno policy or a custom validating webhook) checks a namespace's GPU-hour budget before admitting new GPU-requesting pods during a burst, converting a silent capacity cap (the "pinned node group" failure from Section 2) into an explicit, observable
403with a Slack alert instead of a mysteriously stuckPendingpod.
Security boundaries. MIG and DRA-based partitioning give hardware-enforced tenant isolation at the SM/memory-controller level — this is the property that makes MIG the right default for regulated multi-tenant environments, versus time-slicing or MPS, which share compute cooperatively and leak performance (and in MPS's case, a compromised process can corrupt another tenant's context in the same address space). RBAC on ResourceClaim/ResourceClaimTemplate objects and MIG ConfigMaps is scoped per namespace so a research-pool tenant cannot request an inference-pool profile. Node-level: GPU nodes run with IMDSv2 enforced, driver containers pinned to signed images (see the supply-chain-security session for the Cosign/SLSA angle), and NetworkPolicy isolates the inference pool's east-west traffic from the research pool.
HA and DR. The GPU Operator's own control-plane components (the operator pod itself) run on non-GPU nodes and are trivially replicated; losing them doesn't affect already-configured GPU nodes, only new reconciliation. DCGM Exporter and the MIG Manager are DaemonSets — a control-plane outage doesn't stop inference traffic, only new placement. For multi-region: inference capacity is pre-provisioned per region (GPU nodes take minutes to boot and load drivers — far too slow for a reactive failover), with a global load balancer (or an AI Gateway — see Section 13) shifting traffic away from a degraded region based on p99 latency and error-rate SLOs, not waiting for regional capacity to fail outright. Multi-cloud GPU sourcing (AWS + Azure + on-prem/CoreWeave-style neoclouds) is increasingly how organizations hedge against H100/H200 capacity crunches — the trade-off is that DRA ResourceSlice attributes and MIG profile naming are not portable across cloud device-plugin implementations, so a multi-cloud ResourceClaim template needs cloud-specific overlays, not a single shared manifest.
Why this shape, and how it evolves. At small scale (a handful of GPU nodes), the legacy device plugin with time-slicing is enough — DRA and KAI add operational surface you don't need yet. The inflection point is roughly the same one from the ArgoCD-at-scale session: once you have enough concurrent tenants that fragmentation costs more in wasted GPU-hours than the DRA/KAI operational overhead costs in engineering time, you migrate. At 10x scale, the node-pool segmentation model gets more granular (per-model-family pools, since a Llama-70B-serving pool and a DeepSeek-MoE-serving pool have different NVLink-topology needs), and the FinOps admission gate becomes a full internal capacity-market (bid/reserve semantics, closer to what Google's Borg and Uber's Peloton internally do for shared compute) rather than a simple budget check.
4. Solution Design
Design decision: MIG vs. time-slicing vs. MPS vs. DRA-brokered whole-GPU — pick per workload class, not fleet-wide. The 2026 consensus among platform teams running production LLM fleets: same model, many replicas, no isolation requirement → time-slicing (cheap, simple, GPU Operator's built-in ConfigMap-driven time-slicing, e.g., 4 replicas per H100 for inference fleets serving a single distilled model). Mixed workloads or hard multi-tenant isolation (different teams/customers, regulated data) → MIG, because it's isolation "built in silicon" — a noisy or crashing neighbor cannot degrade or corrupt another tenant's slice, at the cost of fixed profile boundaries (a static 1g.10gb MIG slice wastes capacity when the actual workload needs 7GB or 14GB — teams report 20-30% wasted capacity from profile misalignment). Training/fine-tuning experimentation → MPS (cooperative sharing, higher throughput than time-slicing for compatible CUDA contexts, weaker isolation — acceptable for a single trusted research team, not for external tenants). Heterogeneous, topology-sensitive, or multi-node NVLink workloads (large MoE inference, tensor/pipeline-parallel training) → DRA, because it's the only model expressive enough to say "give me 8 H100s in the same NVLink domain" rather than "give me 8 GPUs, wherever."
Alternative approaches considered and rejected.
- Static per-team node pool carve-up (Team A gets 10 nodes, Team B gets 10 nodes, hard boundary). Rejected as the default because it reintroduces the exact fragmentation problem at coarser grain — Team A's pool sits idle overnight while Team B's is exhausted. Kept as an option only for hard compliance boundaries (e.g., a customer contract requiring physically dedicated hardware).
- Bare device-plugin + manual scheduling hints (
nodeSelector+PriorityClass, no MIG/DRA/KAI). This is where most orgs start and it caps out fast — no fractional sharing means utilization plateaus around 30-40%, and PriorityClass-based preemption without gang scheduling routinely half-launches distributed training jobs, wasting the GPU-hours already spent on the partially-scheduled ones. - Full commercial GPU orchestration platform (NVIDIA Run:ai as a managed product, rather than the open-sourced KAI Scheduler engine underneath it). Valid at large scale if you want vendor support and a UI for capacity management out of the box; the trade-off is cost and a layer of vendor lock-in on scheduling policy. Many platform teams now run KAI Scheduler directly (Apache 2.0, same engine, no license fee) and build their own capacity UI on top of Prometheus/Grafana.
Scalability, cost, security, performance implications. MIG and DRA both reduce cost per useful inference/training-hour by raising utilization, but MIG's fixed profiles mean capacity planning has to model profile-alignment waste explicitly, not just raw GPU-hour cost. DRA adds real scheduling latency at very large ResourceSlice counts (CEL evaluation over thousands of devices) — teams operating at the highest end monitor scheduler decision latency as its own SLO once DRA is in the hot path. Security-wise, the isolation model chosen per workload class is itself the security control — mixing MPS-shared research pods with anything handling regulated data on the same physical GPU is a finding waiting to happen in an audit, so the node-pool segmentation from Section 3 needs to be provably enforced via taints/tolerations and admission policy, not just documented as a convention.
5. Deep Technical Walkthrough
Internal working — from ResourceClaim to running pod. A pod's spec references a ResourceClaimTemplate (e.g., mig-1g.10gb-inference) instead of (or alongside, during migration) resources.requests."nvidia.com/gpu". The DRA scheduler plugin (built into kube-scheduler since DRA went core-GA, or delegated to KAI Scheduler when it's the configured scheduler) evaluates the claim's CEL selector against every node's published ResourceSlice, filters to nodes with a matching, currently-unclaimed device, and — critically, unlike the old device-plugin model — this filtering happens during scheduling, not as a post-hoc kubelet-side allocation. That's what makes topology-aware placement (NVLink domain matching for multi-GPU jobs) possible: the scheduler can reason about which specific devices satisfy a claim before committing to a node, instead of discovering after binding that the assigned GPUs aren't NVLink-connected.
Control plane interactions. Once the scheduler binds the pod to a node and a specific device (recorded in a ResourceClaimStatus), kubelet's DRA plugin manager calls the node-local DRA driver (the GPU Operator-deployed component) via gRPC to actually prepare the device — set up the MIG instance if applicable, configure the container runtime's device cgroup, and inject the right NVIDIA_VISIBLE_DEVICES-equivalent environment into the container. This is a materially different request flow from the legacy device plugin's Allocate() RPC, which only ever dealt with counts.
Data plane interactions. For a multi-node NVLink inference job (e.g., an 8-GPU tensor-parallel serving deployment for a large MoE model), the ComputeDomain support added to the GPU Operator's DRA integration is what lets a ResourceClaim express "these GPUs must share an NVLink/NVSwitch domain across nodes," not just within one node — this is new territory relative to pre-2026 device-plugin scheduling, which had no vocabulary for multi-node interconnect topology at all.
Failure scenarios and recovery. If a node's DRA driver crashes mid-reconciliation, in-flight claims on that node are not silently dropped — ResourceSlice publication stops, the scheduler stops offering that node's devices for new claims, but already-bound pods keep running until the kubelet or node itself is unhealthy (device state is independent of the DRA driver's liveness after initial Allocate). A MIG Manager misconfiguration (applying a profile change to a node with running MIG-backed pods) is one of the most common self-inflicted outages — the GPU Operator's MIG Manager will not reconfigure a GPU with active workloads by default (WaitForWorkloads strategy), but if that safety is overridden, the reconfiguration reboots the GPU's MIG geometry and kills every running pod on it instantly, with no graceful drain.
Performance bottlenecks and scaling behavior. The DCGM Exporter + Prometheus scrape path is your primary signal for DCGM_FI_DEV_GPU_UTIL, DCGM_FI_DEV_FB_USED (framebuffer/HBM usage), and DCGM_FI_DEV_SM_CLOCK throttling events. A common scaling bottleneck at fleet size is DCGM Exporter's own scrape cardinality — per-GPU, per-pod-metadata-enriched metrics multiply fast across hundreds of MIG-sliced devices, and Prometheus cardinality explosions here are a real operational cost that argues for Thanos/remote-write downsampling on GPU metrics specifically, not just general infra metrics.
6. Production Troubleshooting
Walking through the Section 2 incident as a senior SRE would:
Symptom. kubectl describe pod on a Pending vLLM replica shows 0/47 nodes are available: 47 Insufficient nvidia.com/gpu, while cluster-wide GPU allocatable count is nonzero.
Step 1 — confirm it's fragmentation, not exhaustion.
kubectl get nodes -l node.kubernetes.io/instance-type=p5.48xlarge \
  -o custom-columns='NODE:.metadata.name,ALLOC:.status.allocatable.nvidia\.com/gpu,CAP:.status.capacity.nvidia\.com/gpu'

# cross-reference actual utilization, not just allocation count
kubectl exec -n gpu-operator ds/nvidia-dcgm-exporter -- dcgmi dmon -e 203,204,1002 -c 1
If ALLOC == CAP fleet-wide (nothing schedulable by count) but DCGM shows most GPUs at 15-30% SM_UTIL, this confirms fragmentation, not raw capacity shortage — the fix is sharing/rebalancing, not just adding nodes.
Step 2 — check for the silent autoscaler cap.
kubectl get nodepool gpu-inference-pool -o yaml | grep -A5 limits
aws autoscaling describe-auto-scaling-groups --auto-scaling-group-names <gpu-asg> \
  --query 'AutoScalingGroups[0].{Desired:DesiredCapacity,Max:MaxSize}'
This is exactly the Section 2 root cause: a Karpenter NodePool.spec.limits or ASG MaxSize silently capping growth with no user-facing signal beyond a Pending pod. The fix isn't just raising the cap — it's wiring the cap itself into an alert (karpenter_nodepool_limit_reached or equivalent) so it pages someone instead of manifesting as an inference outage two layers removed from the actual constraint.
Step 3 — inspect scheduler decisions for KAI-managed pods.
kubectl logs -n kai-scheduler deploy/kai-scheduler -c scheduler --tail=200 | grep -i "podgroup\|reclaim\|consolidate"
kubectl get podgroup -A -o wide   # gang-scheduling status per distributed job
Look specifically for reclaim events — KAI's fairness engine will preempt lower-priority research/batch pods to satisfy a higher-priority inference podgroup, and if that's not happening, check PriorityClass and queue configuration; a misconfigured queue hierarchy is a common reason "the scheduler should have freed capacity but didn't."
Step 4 — MIG-specific check. If the inference pool is MIG-partitioned, confirm the pending pod's ResourceClaimTemplate requests a profile that actually exists on available nodes:
kubectl get resourceslice -o json | jq '.items[].spec.devices[] | select(.basic.attributes."gpu.nvidia.com/profile".string=="1g.10gb")'
A common misconfiguration: the MIG Manager applies an all-balanced profile to new nodes by default, but the inference workload's claim template was written against a since-changed all-1g.10gb profile name — nodes look "available" but zero devices match the claim's selector.
Step 5 — root cause and remediation. In the composite incident, the actual chain was: (1) research-pool notebooks were requesting whole GPUs via legacy nvidia.com/gpu: 1 instead of MIG slices, fragmenting the shared pool; (2) the inference NodePool had an unannounced limits.nvidia.com/gpu cap set during a cost-control sprint; (3) KAI's reclaim policy wasn't configured to preempt the research pool because its PriorityClass was accidentally set equal to inference. Remediation: migrate research-pool workloads to MIG-based ResourceClaimTemplates (immediate utilization recovery), raise and alert-wire the NodePool limit, and fix the priority hierarchy plus add a PodDisruptionBudget-aware KAI reclaim test to the pre-prod checklist.
7. Hands-on Lab
Goal: stand up GPU Operator with time-slicing (fast to validate without needing MIG-capable hardware in a sandbox), simulate fragmentation, and observe KAI Scheduler-driven consolidation. Runs against any Kubernetes cluster with real or nvidia/vgpu-simulated GPU nodes (a local kind cluster without real GPUs can validate the control-plane wiring; real validation needs actual NVIDIA nodes on EKS/GKE/AKS or on-prem).
# 1. Install the GPU Operator via Helm, with time-slicing enabled from the start
helm repo add nvidia https://helm.ngc.nvidia.com/nvidia && helm repo update

kubectl create ns gpu-operator
kubectl apply -f - <<'EOF'
apiVersion: v1
kind: ConfigMap
metadata:
  name: time-slicing-config
  namespace: gpu-operator
data:
  any: |-
    version: v1
    sharing:
      timeSlicing:
        resources:
        - name: nvidia.com/gpu
          replicas: 4
EOF

helm install gpu-operator nvidia/gpu-operator -n gpu-operator \
  --set devicePlugin.config.name=time-slicing-config \
  --set devicePlugin.config.default=any \
  --wait

# 2. Confirm each physical GPU now advertises 4x allocatable slots
kubectl get nodes -o json | jq '.items[].status.allocatable."nvidia.com/gpu"'

# 3. Install KAI Scheduler
helm repo add nvidia-k8s-device-plugin https://nvidia.github.io/k8s-device-plugin
kubectl create ns kai-scheduler
helm install kai-scheduler oci://ghcr.io/nvidia/kai-scheduler/kai-scheduler \
  -n kai-scheduler --set global.registry=ghcr.io/nvidia/kai-scheduler

# 4. Deploy a mixed workload: 6 "research" pods requesting whole slices (simulating fragmentation)
#    and a "priority" inference PodGroup requesting more than naive scheduling would free
kubectl apply -f - <<'EOF'
apiVersion: v1
kind: Pod
metadata:
  name: research-fragment-1
  labels: {app: research}
spec:
  schedulerName: kai-scheduler
  priorityClassName: low-priority
  containers:
  - name: burn
    image: nvidia/cuda:12.4.0-base-ubuntu22.04
    command: ["sleep", "3600"]
    resources:
      limits: {nvidia.com/gpu: 1}
EOF
# (repeat/scale to fill capacity, then submit a high-priority inference PodGroup)

# 5. Watch KAI reclaim low-priority pods to satisfy the higher-priority podgroup
kubectl get podgroup -A -w
kubectl logs -n kai-scheduler deploy/kai-scheduler --tail=100 -f

# 6. Validate: inference pods reach Running, DCGM shows utilization concentrated
#    rather than fragmented across many low-util GPUs
kubectl exec -n gpu-operator ds/nvidia-dcgm-exporter -- dcgmi dmon -e 203 -c 1

# 7. Cleanup
kubectl delete pod -l app=research
helm uninstall kai-scheduler -n kai-scheduler
helm uninstall gpu-operator -n gpu-operator
kubectl delete ns gpu-operator kai-scheduler
Validation checkpoints: allocatable GPU count quadruples after time-slicing config lands (step 2); podgroup status transitions from Pending to Running only as a full gang, never partially (step 5); DCGM utilization concentrates rather than spreading thin post-reclaim (step 6). Cleanup removes both Helm releases and namespaces so the cluster returns to baseline.
8. Production Case Study
NVIDIA's own internal GPU fleets are the reference case for this exact stack — Run:ai's engine (now KAI Scheduler) was built specifically to solve GPU fragmentation and fairness across thousands of internal and customer GPUs, and NVIDIA's decision to open-source it and donate the DRA driver to CNCF at KubeCon EU 2026 is a direct signal of where they see the ecosystem converging: DRA as the substrate, KAI (or a DRA-aware scheduler) as the policy engine on top.
Uber's Michelangelo/Peloton lineage solved an analogous problem years before GPUs were the bottleneck resource — Peloton's unified resource scheduler was built precisely because CPU/memory fragmentation across mixed batch and online workloads produced the same "capacity exists but nothing can schedule" symptom now showing up with GPUs. The architectural lesson transfers directly: a fairness- and gang-aware scheduler layered above the kernel scheduler, with explicit resource pools per workload class, beats trying to make the default scheduler's bin-packing heuristics do double duty.
OpenAI and Anthropic-scale inference platforms (based on public engineering commentary and the general shape of the industry's large-model serving stacks) converge on the same three moves covered here: fractional/topology-aware GPU allocation instead of whole-GPU requests, gang scheduling for any multi-GPU tensor/pipeline-parallel deployment (a half-launched 8-way tensor-parallel job is worse than not scheduling it at all — it burns GPU-hours without ever serving a token), and hard capacity segmentation between latency-SLA'd inference and interruptible training/batch, because the two have fundamentally incompatible autoscaling and preemption tolerances.
Google's Borg/Kubernetes lineage is the historical precedent for why DRA looks the way it does — Borg long modeled hardware resources as attribute-rich, not just countable, precisely to support the kind of topology- and generation-aware placement that Kubernetes' original device-plugin model couldn't express. DRA reaching GA in 1.34/1.35 is, in a real sense, Kubernetes catching up to a scheduling model Borg validated internally over a decade earlier.
9. Architecture Review
Strengths. Node-pool segmentation by SLA class prevents an inference-serving outage from being caused by a research notebook, which is the single highest-value structural decision in this design. Layering DRA + KAI over the legacy device plugin lets teams migrate incrementally — legacy nvidia.com/gpu requests and DRA ResourceClaims coexist during transition, so this isn't a rip-and-replace. MIG's hardware-enforced isolation gives a genuinely strong multi-tenant security boundary that software-only approaches (time-slicing, MPS) cannot match.
Weaknesses. DRA's CEL-based ResourceSlice matching adds real scheduling latency at high device cardinality, and this architecture doesn't specify a fallback if DRA scheduling decisions start exceeding SLO — that's a gap. MIG's fixed profile boundaries mean the 20-30% profile-misalignment waste cited in Section 4 is baked into the design unless profile selection is actively re-tuned against observed workload shape, which requires operational discipline this architecture assumes but doesn't enforce. The FinOps admission-gate webhook is a single point of failure for all GPU scheduling during a burst if it's not itself highly available and fast — a slow or down budget-check webhook turns into an inference outage.
What fails first at 10x scale. The DCGM Exporter/Prometheus metrics path is the first thing to buckle — per-GPU, per-MIG-slice, per-pod-metadata cardinality grows multiplicatively with fleet size and tenancy, and without remote-write downsampling or a Thanos-style long-term-storage split specifically tuned for GPU metrics, Prometheus scrape and query latency degrades before the scheduling layer does. Second: KAI's consolidation pass (live rescheduling to defragment) becomes more expensive and riskier to run frequently as podgroup count grows, so the consolidation interval itself becomes a tuning knob under real load rather than a fire-and-forget default.
At 100M-user / hyperscaler-adjacent scale, node-pool segmentation evolves into a real internal capacity market (bid/reserve/preempt economics, closer to Borg's priority-bands or a cloud provider's own spot-market internals) rather than a fixed pool split, and DRA ResourceSlice topology data becomes an input to a placement optimizer that spans regions, not just a single cluster's scheduler — at that point you're not choosing between MIG and time-slicing per workload, you're running a continuous optimization over the entire fleet's GPU-hour allocation, closer to airline yield management than to kube-scheduler's per-pod filter/score loop.
What I'd redesign. Make the FinOps budget gate advisory-with-alerting by default rather than hard-blocking during traffic bursts — a hard 403 on a legitimate SLA-driven scale-out is its own outage; a soft-block-plus-page gives humans the chance to override before the inference SLA breaches. I'd also formalize MIG profile re-tuning as a scheduled job (analyze DCGM framebuffer-usage histograms weekly, propose profile changes) rather than leaving it as an implicit operational responsibility nobody owns until utilization complaints surface.
10. Best Practices
Reliability. Never let a MIG Manager reconfiguration run against a node with live workloads — keep migManager.env.WAIT_FOR_WORKLOADS=true (the GPU Operator default) and treat any override as an explicit, reviewed change. Gang-schedule every multi-GPU distributed job through KAI's PodGroup (or an equivalent), never bare Deployment/Job replicas, to avoid burning GPU-hours on half-launched jobs.
Scalability. Segment node pools by workload SLA and interruptibility before you segment by anything else — team, cost center, or model family are secondary axes. Prefer DRA ResourceClaims over bare nvidia.com/gpu counts for any workload with topology requirements (multi-GPU, multi-node), since that's the only model expressive enough to avoid post-hoc "wrong nodes, wrong topology" failures.
Observability. Scrape DCGM Exporter with pod-metadata enrichment so GPU utilization is attributable per tenant/namespace, not just per node — this is the metric set that turns "the cluster is exhausted" into "team X's research pods are holding 40 idle GPUs," which is the actionable version of the same fact. Track scheduler decision latency (both kube-scheduler and KAI) as its own SLO once DRA is in the hot path at scale.
Security. Default to MIG for any workload crossing a tenant/compliance boundary; reserve MPS and time-slicing for single-trusted-team scenarios. Enforce node-pool taints/tolerations and admission policy (Kyverno/OPA) as the provable isolation boundary — don't rely on documented convention alone.
Cost optimization. Put interruptible/batch workloads on Spot capacity with Karpenter consolidation enabled; never do this for the inference pool. Re-tune MIG profile mix against observed DCGM framebuffer-usage histograms on a schedule, since static profile choices decay in efficiency as workload shape drifts.
Performance. Match sharing strategy to workload pattern per Section 4's decision tree rather than picking one strategy fleet-wide — a single wrong default (e.g., MIG everywhere, including same-model high-replica inference where time-slicing would do) leaves real throughput on the table.
Maintainability / operational excellence. Manage GPU Operator, MIG profiles, and DRA ResourceClaimTemplates through GitOps (ArgoCD/FluxCD — see the prior session on ArgoCD at fleet scale), not imperative kubectl apply, so profile and scheduling-policy drift is auditable and revertible exactly like any other cluster config.
11. Common Production Mistakes
Requesting whole GPUs (nvidia.com/gpu: 1) for workloads that only need a fraction of a card is the single biggest cause of the fragmentation failure mode in Section 2 — teams default to this because it's the path of least resistance in tutorials, not because it matches actual resource need. Running MIG reconfiguration against live-workload nodes without WAIT_FOR_WORKLOADS is a self-inflicted outage that looks like a mysterious mass pod eviction until someone checks the MIG Manager logs. Treating CPU-based HPA as sufficient for GPU inference autoscaling ignores that GPU inference is rarely CPU-bound — scale decisions need to be driven by queue depth, GPU utilization, or p99 latency, not CPU percent. Setting Karpenter NodePool or ASG capacity limits without wiring them into an alert turns a deliberate cost-control decision into a silent, hard-to-diagnose capacity outage weeks later, exactly as happened in Section 2. Mixing regulated or multi-customer workloads on MPS or time-sliced GPUs because it's cheaper than MIG, without an explicit risk acceptance, is a compliance finding waiting to happen — the isolation trade-off has to be a conscious decision, not a cost-driven default nobody signed off on.
12. Interview Preparation
"Walk me through why a Kubernetes cluster can show GPUs as allocatable while GPU-requesting pods are still Pending." Because the legacy device-plugin model allocates whole GPUs by count with no fractional or topology awareness — a cluster can be simultaneously "exhausted" (no free whole GPUs to hand out) and "underutilized" (existing allocations are only using a fraction of each card's compute/memory). The fix is fractional sharing (MIG/time-slicing/MPS) matched to workload need plus a scheduler (KAI or DRA-aware kube-scheduler) that can reason about fractions and topology instead of just counts.
"When would you choose MIG over time-slicing, and what do you give up either way?" MIG when tenant isolation is a hard requirement — regulated data, external customers, or any scenario where a noisy/crashing neighbor cannot be allowed to degrade another workload — at the cost of fixed profile boundaries and the resulting profile-misalignment waste (commonly cited at 20-30%). Time-slicing when workloads are homogeneous, trusted, and throughput-sensitive (e.g., many replicas of the same distilled model behind vLLM) — cheaper operationally, no hardware isolation, so a runaway or misbehaving pod can starve its neighbors on the same physical card.
"What problem does Dynamic Resource Allocation solve that the device-plugin model couldn't?" Attribute- and topology-aware device selection — DRA lets a workload express "a device matching these attributes" (memory, generation, NVLink domain, driver version) via ResourceClaim/ResourceSlice, evaluated during scheduling rather than discovered post-hoc at the kubelet. This is what makes correct placement of multi-GPU, NVLink-topology-sensitive workloads possible without hand-rolled node affinity hacks.
"How do you design gang scheduling for distributed training, and why does it matter?" Use a scheduler with native PodGroup/gang-scheduling support (KAI, Volcano) so a distributed job is placed all-or-nothing — without it, a partial launch (e.g., 5 of 8 tensor-parallel ranks scheduled) burns GPU-hours on pods that can never actually do useful work since the job can't start without every rank, and it can silently starve other pending work while holding partial capacity.
"Design a multi-tenant GPU platform for a company running both real-time inference and research training on the same fleet. What's your node-pool strategy?" Segment by SLA and interruptibility first (on-demand/PDB-protected inference pool, Spot/interruptible batch pool, time-sliced or MPS research pool), enforce the boundary via taints and admission policy rather than convention, and drive scale-out decisions off workload-appropriate signals (queue depth/p99 latency for inference, queue backlog for batch) rather than a single fleet-wide autoscaling policy.
"What's your incident response when GPU utilization metrics show 20% fleet-wide but inference pods are Pending?" Confirm fragmentation vs. genuine exhaustion by cross-referencing Allocatable/Capacity against DCGM per-GPU utilization; check for silent capacity caps (NodePool/ASG limits) that aren't wired into alerting; inspect the scheduler's fairness/preemption behavior for misconfigured priority classes preventing reclaim; and check MIG profile alignment between what's requested and what's actually available on candidate nodes.
13. Latest Industry Updates
Kubernetes 1.34/1.35 — DRA reaches GA and becomes default. Dynamic Resource Allocation's core API went GA in Kubernetes 1.34 and is now stable and enabled by default in 1.35 — this is the single biggest structural change to GPU (and broader accelerator) scheduling since the device-plugin model shipped in 1.8, and it directly determines the architecture in this session. Platform teams still on pre-1.34 clusters should treat DRA migration planning as a near-term priority, not a someday item.
NVIDIA donates its DRA driver to CNCF (KubeCon EU 2026). Moving GPU DRA driver development into CNCF governance is the clearest signal yet that attribute-based, topology-aware GPU scheduling is becoming a cross-vendor standard rather than an NVIDIA-only mechanism — worth watching for how AMD/Intel accelerator vendors respond with their own DRA drivers on the same resource.k8s.io substrate.
KAI Scheduler's continued growth as the open GPU-scheduling default. Since NVIDIA open-sourced it (Apache 2.0) from the Run:ai acquisition, KAI has become the reference implementation platform teams reach for instead of hand-rolling PriorityClass/cron-based bin-packing — worth tracking its roadmap for deeper DRA-native integration as both projects mature together.
GPU Operator 26.x line adds native DRA driver lifecycle management. The GPUCluster CRD and ComputeDomain support for multi-node NVLink mean the GPU Operator itself now manages the DRA driver end-to-end, including preconfigured MIG-device ResourceClaims — closing the gap between "DRA is GA in core Kubernetes" and "DRA is actually operable day-2 on a real GPU fleet without hand-built tooling."
Why this matters for production: every one of these developments points the same direction — GPU scheduling is moving from "a resource count kubelet hands out" to "a first-class, attribute-rich, topology-aware allocation problem," matching how large-scale internal schedulers (Borg, Peloton) have modeled hardware for years. Teams that build their multi-tenant GPU platform on DRA + KAI now are building on the direction Kubernetes itself is heading, not a vendor-specific detour.
14. Summary & Cheat Sheet
Key concepts. GPU node exhaustion is usually a fragmentation problem, not a raw capacity problem — the legacy device-plugin model can only allocate whole GPUs by count, so a cluster can show allocatable GPUs while being functionally exhausted for fractional workloads. MIG gives hardware-enforced isolation at the cost of fixed profile boundaries; time-slicing and MPS give cheaper, software-level sharing with weaker isolation guarantees. DRA (GA in 1.34, default in 1.35) replaces "give me a count" with "give me a device matching these attributes," enabling topology-aware placement DRA's predecessor couldn't express. KAI Scheduler adds gang scheduling, fractional bin-packing, and defragmentation on top of either model.
Architecture pattern. Segment GPU node pools by workload SLA and interruptibility (inference / batch-Spot / research) before any other axis; layer GPU Operator (driver + DRA driver + MIG Manager + DCGM) → DRA ResourceSlice/ResourceClaim → KAI Scheduler → Karpenter provisioning → workload-appropriate autoscaling signal (queue depth/p99, not raw CPU) → FinOps admission gate wired to alerting, not silent caps.
Commands worth keeping handy.
kubectl get nodes -o json | jq '.items[].status.allocatable."nvidia.com/gpu"'
kubectl exec -n gpu-operator ds/nvidia-dcgm-exporter -- dcgmi dmon -e 203,204,1002 -c 1
kubectl get resourceslice -o json | jq '.items[].spec.devices[].basic.attributes'
kubectl get podgroup -A -w
kubectl logs -n kai-scheduler deploy/kai-scheduler --tail=200 | grep -i reclaim
Design patterns. Fractional sharing strategy chosen per workload class (isolation need vs. throughput need), never fleet-wide by default. Gang scheduling for every multi-GPU distributed job, no exceptions. GitOps-managed MIG profiles and ResourceClaimTemplates for auditability. Capacity caps always wired to alerts, never silent.
Troubleshooting checklist. Confirm fragmentation vs. exhaustion via Allocatable vs. DCGM utilization → check for unannounced NodePool/ASG limits → inspect scheduler fairness/preemption/reclaim behavior and PriorityClass hierarchy → verify MIG profile alignment between claim templates and actually-available devices → check DRA ResourceSlice publication health on suspect nodes.
Daily DevOps Mentor — 2026-08-27