
KEDA at Production Scale: Event-Driven & GPU-Aware Autoscaling from Queue Depth to Inference Load
Daily DevOps Mentor — 2026-09-08
1. Topic of the Day
The Horizontal Pod Autoscaler has one structural blind spot that every platform team eventually collides with: it can only scale on resource metrics (CPU, memory) or a custom/external metric you've wired up yourself through the custom.metrics.k8s.io or external.metrics.k8s.io API, and even then it enforces a hard floor of one replica. That's fine for a stateless web tier where request rate correlates reasonably well with CPU. It falls apart the moment your workload is a Kafka consumer, an SQS/RabbitMQ processor, a cron-shaped batch job, or a GPU-bound inference server — in every one of these, CPU utilization is a lagging, often misleading proxy for the thing that actually matters: queue depth, message lag, or request-queue occupancy on the GPU. A consumer pulling from a backed-up Kafka topic can sit at 15% CPU while consumer lag climbs into the millions, because the bottleneck is downstream I/O or per-message processing latency, not compute. HPA, watching CPU, does nothing. Ops watches lag climb on a dashboard and pages someone to kubectl scale by hand.
KEDA (Kubernetes Event-Driven Autoscaling) exists to close this gap without replacing HPA — it's an architectural layer in front of HPA. KEDA doesn't reimplement Kubernetes' scaling control loop; it implements the Kubernetes external metrics API and acts as a metrics adapter plus a small operator that translates event-source state (Kafka lag, SQS queue length, a Prometheus query result, a cron schedule, GPU queue depth from a custom exporter) into a metric HPA can consume, and it patches replica count directly to zero when every configured trigger reports empty — something HPA structurally cannot do on its own since it enforces minReplicas >= 1. A CNCF Graduated project since August 2023 (following Microsoft and Red Hat's original contribution), KEDA ships 70+ built-in scalers today, covering essentially every message broker, cloud queue service, database, and monitoring system a platform is likely to run, plus a gRPC-based external scaler protocol for anything bespoke.
The reason this matters more in September 2026 than it did three years ago is the collision between event-driven autoscaling and AI inference workloads. GPU-backed model servers have exactly the same shape of problem as a Kafka consumer, worse: GPU utilization reported by nvidia-smi-style metrics is notoriously unreliable as a scaling signal for LLM inference (a GPU can show high SM utilization while still having KV-cache headroom to serve more concurrent requests, or show moderate utilization while being fully saturated on memory bandwidth), and GPU capacity is the most expensive compute a platform runs, at $2-5+/hour per accelerator for the current H100/H200/B200 generation. Scaling GPU inference replicas on CPU or naive GPU-utilization percentage either leaves paid-for accelerators idle (direct cost) or under-provisions during load spikes (latency SLO breach). Through 2026 the KEDA community and CNCF ecosystem invested specifically in GPU-aware external scalers — pulling request-queue depth, KV-cache occupancy, and NVIDIA DCGM-exported metrics directly into KEDA's scaling decision — which is exactly the same architectural pattern KEDA has used for a decade for message queues, applied to the newest and most expensive resource class in the cluster.
Today's session designs a production KEDA architecture end to end: the ScaledObject/ScaledJob mechanics, how KEDA composes with cluster autoscalers like Karpenter for the node-provisioning half of the story, the GPU-aware inference-scaling pattern that's become the 2026 reference architecture, and where event-driven autoscaling breaks down under real production load.
2. Real Business Problem
Symptom: A mid-size fintech runs an order-processing pipeline: API gateway → Kafka topic (orders.pending) → a consumer Deployment that validates, enriches, and writes orders to Postgres → a second Kafka topic feeding a fraud-scoring service that calls an internally hosted fine-tuned classifier model on a GPU node pool. The consumer Deployment is HPA'd on CPU at 70% target, minReplicas: 3, maxReplicas: 20. The fraud-scoring GPU service runs a fixed 4 replicas, sized for average load, because "GPU pods are expensive and nobody trusts autoscaling them."
Three incidents in the same quarter:
- Black Friday queue backup. Order volume spikes 9x over 90 minutes. The Kafka consumer's CPU barely moves past 40% — each message triggers a network call to an enrichment service with p50 latency of 180ms, so the bottleneck is I/O wait, not CPU. HPA never scales past 4-5 replicas because CPU never crosses the 70% threshold. Consumer lag on
orders.pendingclimbs past 400,000 messages. Orders placed during the spike don't get fraud-scored and confirmed for up to 45 minutes, well outside the 2-minute SLA communicated to merchants. The on-call engineer's fix is a manualkubectl scale deployment order-consumer --replicas=25, applied 35 minutes into the incident because nobody was paged on lag — only on downstream symptoms (merchant complaints). - Idle GPU spend. The fraud-scoring GPU pool runs at a fixed 4 replicas around the clock. Nighttime and weekend traffic is roughly 8% of peak. Finance's monthly GPU line item shows the pool costing the same at 3am Sunday as it does at 2pm Black Friday — a FinOps review calculates that scaling this pool with actual demand would cut GPU spend on this workload by more than half, money currently just idling.
- Scheduled batch job contention. A nightly reconciliation batch job (a
CronJobreprocessing the day's transactions against a ledger) runs as a fixed-sizeDeploymentthat's always running, consuming baseline cluster capacity 24/7 even though it only does real work for about 90 minutes a night, because turning it into a trueCronJobthat scales to zero when idle "was on the backlog but never a priority" — it's just accepted waste until someone counts up the idle-hour node cost.
The ask, verbatim from the platform lead after the FinOps review: "Every workload that has a natural event signal — queue depth, message lag, a schedule, a GPU request queue — should scale on that signal, not on CPU as a fallback proxy, and it should be able to scale to and from zero, not just between some minimum and some maximum we picked once and never revisited." That's the KEDA mandate: replace CPU-proxy autoscaling with autoscaling driven by the actual event source, across both ordinary microservices and GPU inference workloads, with scale-to-zero as a first-class option rather than an afterthought.
3. Production Architecture
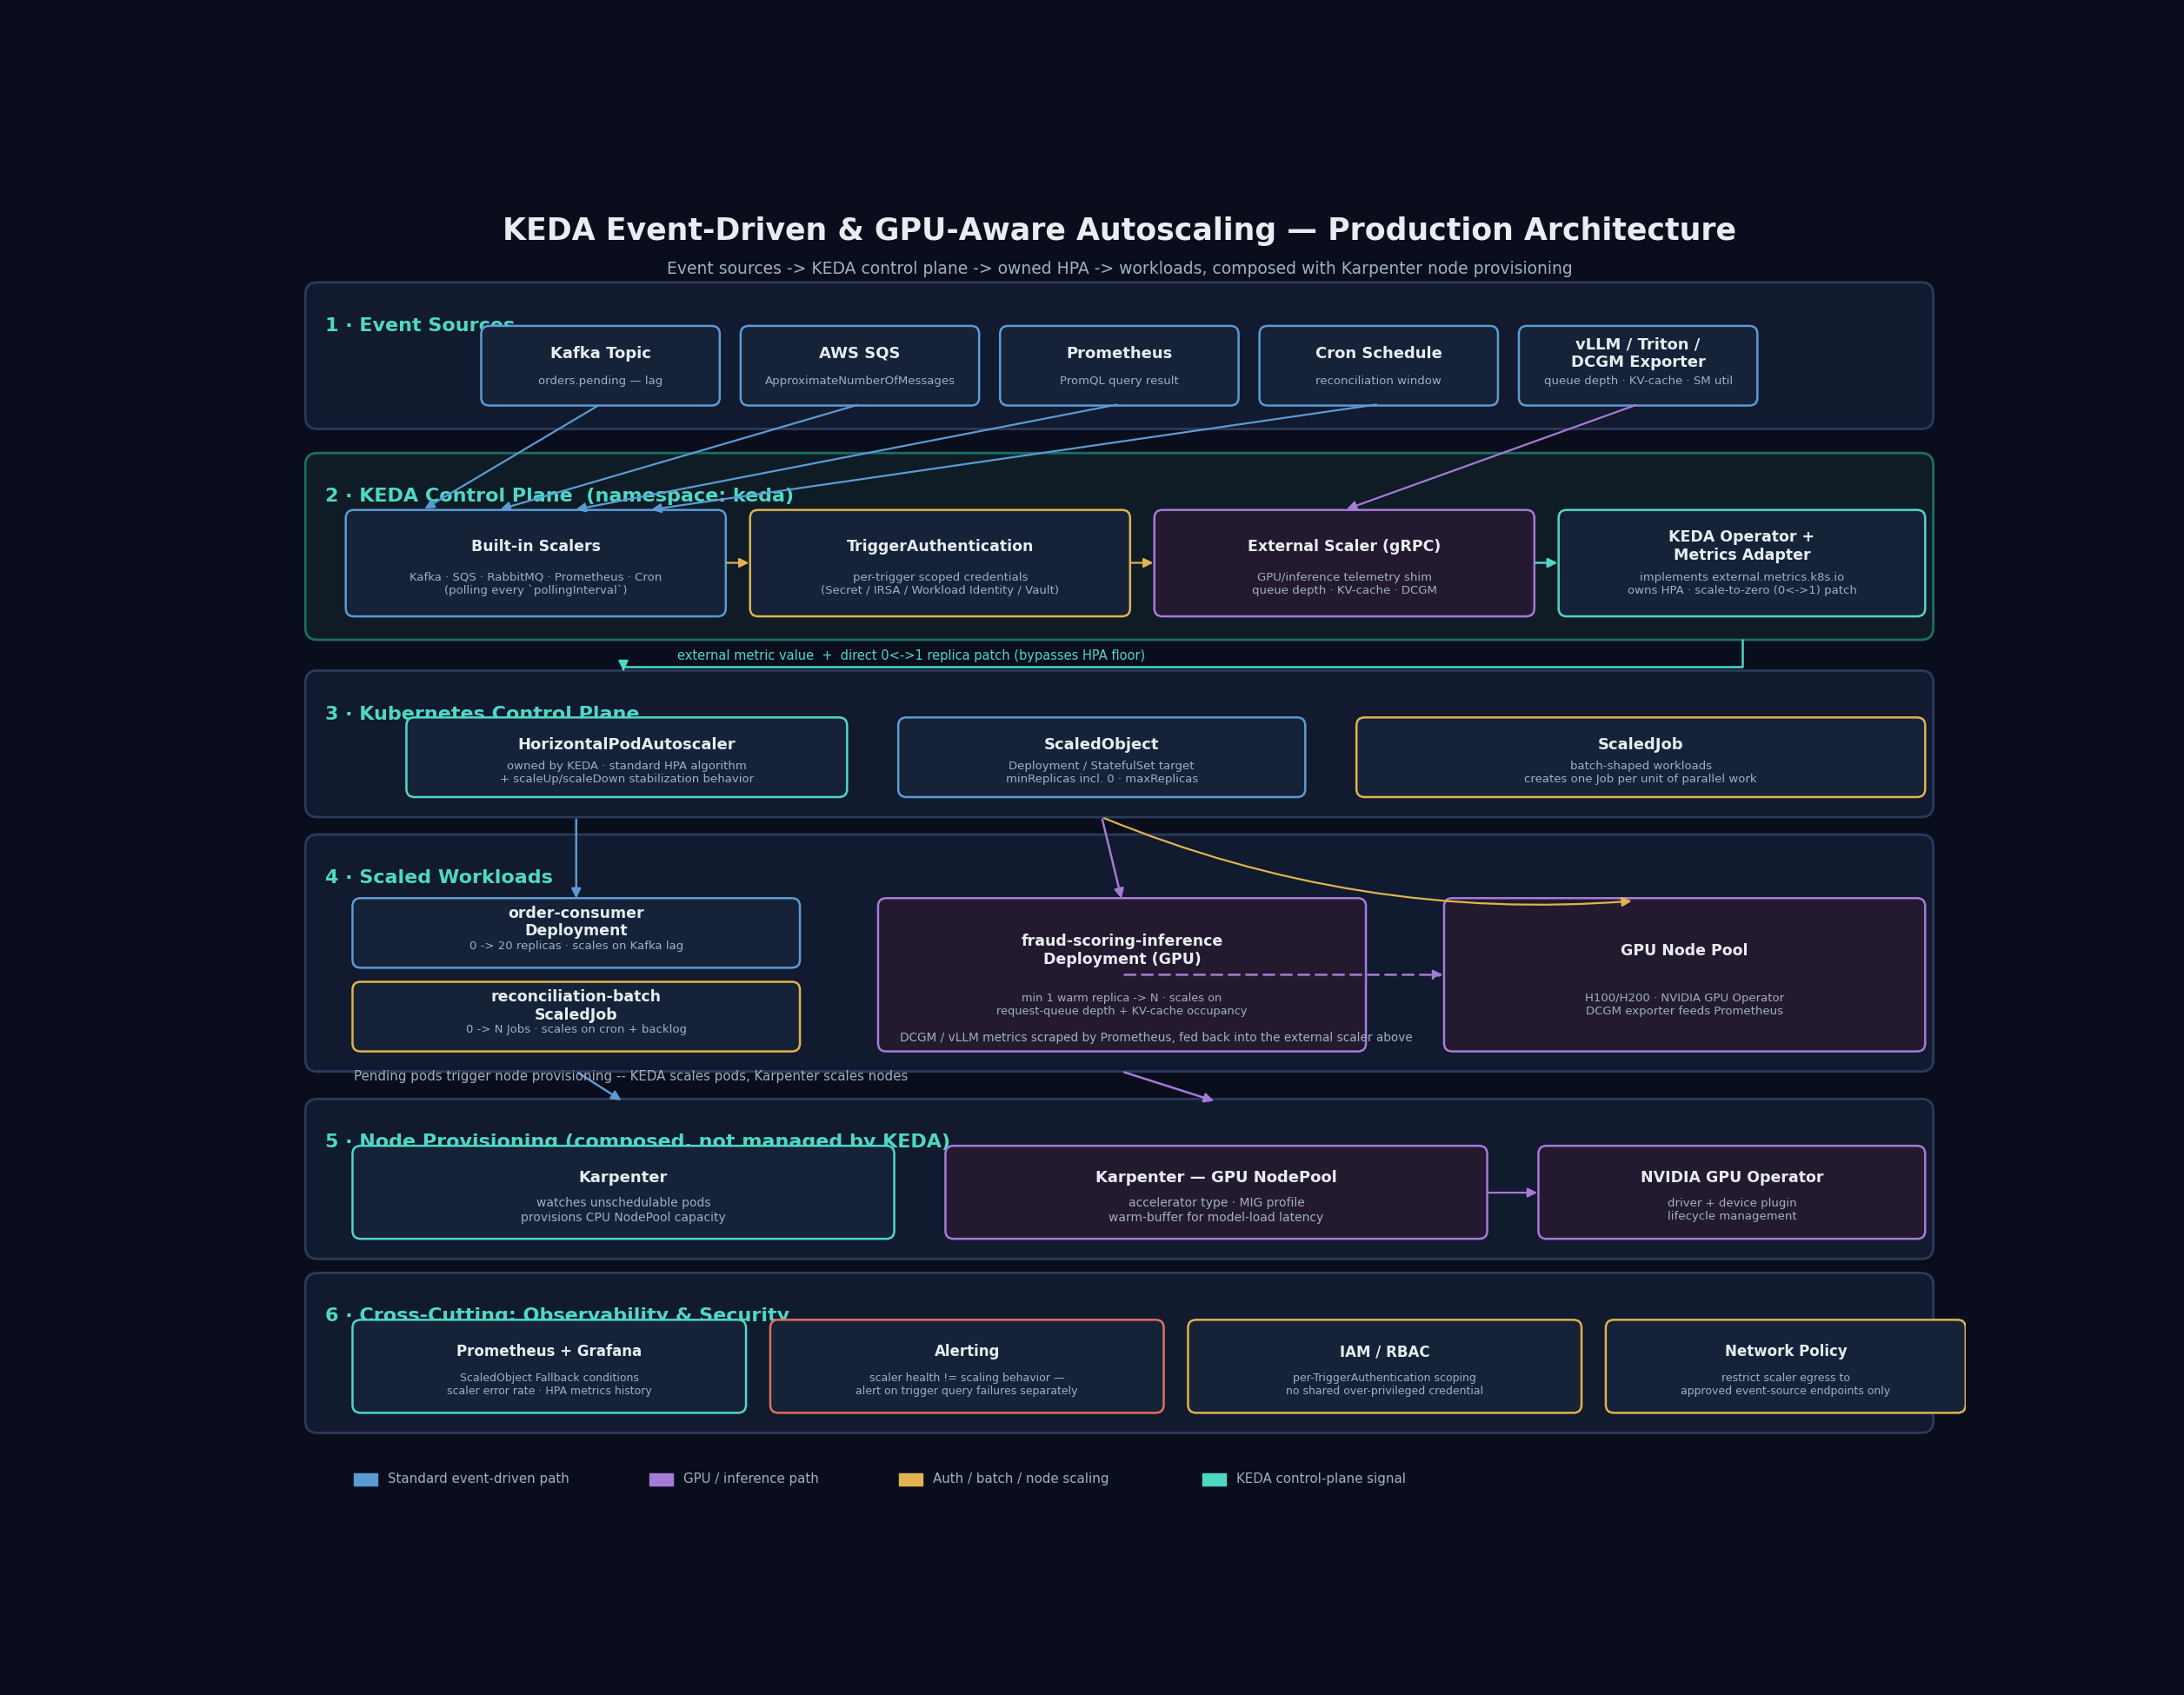
Control plane — KEDA operator and metrics server. KEDA deploys as two core components in the keda namespace: the KEDA Operator, which watches ScaledObject and ScaledJob custom resources and reconciles them, and the KEDA Metrics Adapter, which implements the Kubernetes external.metrics.k8s.io API server so that the standard Kubernetes control plane (specifically the HPA controller inside kube-controller-manager) can query KEDA-sourced metrics exactly as it would query any resource metric. This is the architectural decision that makes KEDA composable rather than a fork: KEDA does not run its own competing autoscaling control loop for Deployment-backed workloads — it creates and owns a standard HorizontalPodAutoscaler object on the user's behalf, sets its metric source to the external metrics API, and lets the existing, battle-tested HPA control loop do the actual scaling math and rate-limiting.
Trigger layer — scalers. A ScaledObject references a target workload (Deployment, StatefulSet, or any custom resource implementing scale subresource) and a list of triggers — Kafka consumer lag on a topic/consumer-group, AWS SQS ApproximateNumberOfMessages, a PromQL query result, RabbitMQ queue length, or a cron expression. Each trigger type is implemented as a scaler: a piece of Go code inside the KEDA operator (for built-in scalers) or an external gRPC service implementing KEDA's ExternalScaler protocol (for anything not built in — this is the extension point used for the GPU/inference scalers). On each polling interval (pollingInterval, default 30s, tunable per ScaledObject), KEDA queries every configured trigger, and if any trigger reports non-zero activity, it ensures the target's HPA-managed replica count is at least 1 (waking it from zero if needed); the actual scale-out math from there — how many replicas for how much lag — is delegated to the HPA object KEDA created, using the external metric value KEDA is now feeding it.
Scale-to-zero path. This is the piece HPA cannot do alone. When minReplicas: 0 is set on a ScaledObject and every trigger reports empty (no messages, no lag, cron window closed), KEDA's operator directly patches the target Deployment's replica count to zero — bypassing HPA for this transition, since HPA's own controller refuses to manage a workload below 1 replica. Coming back from zero works in reverse: KEDA detects trigger activity during a polling cycle, scales the target to 1 replica directly (again bypassing HPA for this specific transition), and once at least 1 replica is running, hands control back to the HPA object for further scale-out. The cooldownPeriod (default 300s) controls how long KEDA waits after triggers go quiet before scaling to zero, preventing flapping on a bursty-but-not-actually-idle queue.
Job-based workloads — ScaledJob. For workloads better modeled as a batch of independent units of work than a long-running Deployment (process N messages, then exit), KEDA offers ScaledJob, which creates a Kubernetes Job per unit of parallel work rather than scaling a Deployment's replica count. Each polling interval, KEDA calculates the desired number of concurrent Jobs from the trigger metric (e.g., queue length / Job's per-pod processing capacity) and creates that many Job objects up to maxReplicaCount, with scalingStrategy controlling how aggressively to launch relative to accumulating backlog. This is the correct shape for the nightly reconciliation batch job from Section 2 — it converts a permanently-running Deployment into ScaledJobs that only exist while there's queue backlog to drain, then disappear entirely.
Node-level composition with Karpenter. KEDA scales pods; it has no opinion about nodes. When a ScaledObject drives a Deployment from 4 to 40 replicas in response to a lag spike, those new pods land in Pending state if the cluster lacks capacity, and it's Karpenter (or cluster-autoscaler) watching for unschedulable pods that provisions the nodes to satisfy them. This is a deliberate two-layer separation, the same shape as the Karpenter session covered previously: KEDA answers "how many replicas does this workload need right now, based on its actual event backlog," Karpenter answers "what nodes does the cluster need to run that many replicas." For GPU workloads this composition matters even more — Karpenter's GPU NodePools need requirements (accelerator type, MIG profile) that match what the scaled-out inference pods request, and GPU node provisioning latency (tens of seconds to minutes, plus driver/device-plugin readiness) is exactly why inference scaling needs a warm-buffer strategy, covered in Section 5.
GPU/inference scaling layer. For GPU-backed inference workloads, the natural scaling signal isn't a message queue — it's request-queue depth and KV-cache occupancy on the model server itself (vLLM, Triton, etc. expose these via a /metrics endpoint), or GPU-level telemetry from NVIDIA DCGM. Since none of this is a KEDA built-in scaler, production platforms implement a small external scaler: a gRPC service (deployable as a lightweight Deployment, often a DaemonSet-fed aggregator for node-level DCGM metrics) that KEDA's operator calls on each polling cycle, which in turn queries Prometheus (scraping vLLM's /metrics or DCGM exporter) and returns a normalized metric value KEDA feeds into the same ScaledObject/HPA pipeline as any other trigger. This reuses 100% of KEDA's existing scale-to-zero, cooldown, and HPA-composition machinery — the only new piece of infrastructure is the external scaler translating GPU/inference telemetry into KEDA's trigger protocol.
Why this layered shape, and the trade-off. The alternative — building a bespoke GPU-autoscaling controller that watches Prometheus directly and patches replica counts itself — was rejected because it means re-implementing cooldown/hysteresis logic, HPA composition, and scale-to-zero semantics that KEDA already has, tested, for every new event source. The cost of the KEDA-based approach is an extra network hop per polling cycle (KEDA operator → external scaler → Prometheus) and a small amount of latency in reacting to load spikes (bounded by pollingInterval), which is an acceptable trade for not maintaining a parallel scaling control loop.
4. Solution Design
Build vs. adopt for the scaling layer. KEDA itself is the "adopt" answer for the vast majority of event sources — writing a custom controller that watches Kafka lag or SQS depth and patches replica counts is a well-worn mistake platform teams make before discovering KEDA, and it means reimplementing rate-limiting/hysteresis/HPA-composition from scratch. The only "build" surface that's usually necessary is the external-scaler gRPC shim for a metric source with no built-in scaler — GPU/inference telemetry today, historically anything bespoke like an internal work-queue service — and that shim is intentionally thin (translate a metric query into KEDA's protocol), not a full autoscaling engine.
Alternatives considered and rejected:
- Custom Prometheus Adapter (
k8s-prometheus-adapter) instead of KEDA. This gets you PromQL-driven HPA metrics without KEDA at all, and it's a legitimate lighter-weight choice if every trigger source can be expressed as a Prometheus query and scale-to-zero isn't required. It was rejected here because two of the three problems from Section 2 (SQS/Kafka lag as a native metric, not proxied through a Prometheus exporter someone has to build and maintain, and true scale-to-zero for the batch job) are exactly the gaps KEDA closes that the Prometheus adapter alone doesn't. - Vendor-managed autoscaling (e.g., AWS App Runner concurrency scaling, Knative for pure request-driven scale-to-zero). Knative is a strong option if the workload is purely HTTP-request-driven and the team wants an opinionated serverless platform; it was rejected for the order-processing/fraud-scoring workloads because they're not request/response HTTP services — they're queue consumers and GPU batch-inference-shaped workloads that don't fit Knative's request-concurrency model cleanly.
- Scaling GPU pods on raw
nvidia-smiGPU-utilization percentage via a simple custom metric. Considered and explicitly rejected for the fraud-scoring service — GPU utilization percentage is a poor proxy for "can this replica accept more concurrent requests," for the reasons in Section 1 (KV-cache/memory-bandwidth saturation can occur at moderate reported utilization). Request-queue depth and KV-cache occupancy, pulled from the model server's own metrics, are the signals that actually correlate with capacity.
Scalability considerations. KEDA's polling model means every ScaledObject's trigger check is an independent query against its event source on its own interval — at high ScaledObject counts (hundreds to low thousands per cluster) this becomes real load against Kafka, the cloud provider's API (SQS/CloudWatch rate limits are a real constraint), or Prometheus, and pollingInterval needs to be tuned per workload class rather than left at the 30s default everywhere — a low-priority batch trigger can poll every few minutes; a latency-sensitive inference trigger may need a shorter interval, trading polling load for reaction speed.
Cost implications. The ROI case is the direct inverse of Section 2's idle-GPU-spend incident: the fraud-scoring pool moving from a fixed 4 replicas to KEDA-driven scale-between-zero-and-N against actual queue depth captures the majority of the idle-hours cost that FinOps identified, and the batch-job conversion to ScaledJob removes 24/7 baseline node cost for a workload that only runs 90 minutes a night. The trade-off to budget for explicitly: scale-to-zero for GPU workloads reintroduces cold-start latency (model load time) on the first request after an idle period, which needs either an accepted SLO exception for "first request after idle" or a warm-buffer strategy that partially offsets the cost savings.
Security implications. External scalers that call out to Prometheus or a cloud provider's metrics API need their own service-account/IAM scoping — a common misconfiguration is granting the KEDA operator's service account broad read access to every metrics source in the account rather than scoping per-trigger credentials, which turns a compromised KEDA operator into a lateral-movement path into every queue and metrics backend it's configured to poll. KEDA supports per-TriggerAuthentication credential scoping (via TriggerAuthentication/ClusterTriggerAuthentication CRDs referencing a Secret, a cloud IAM role via IRSA/Workload Identity, or a Vault/External Secrets-managed credential) specifically so triggers don't all share one over-privileged identity.
Performance implications. The reaction-time floor for any KEDA-driven scale event is bounded by pollingInterval plus whatever latency the trigger source itself has (a Prometheus query against a busy TSDB, a CloudWatch API call subject to AWS API rate limits) plus, for scale-from-zero, cold-start time of the target pod (image pull, container start, for GPU workloads model-weight loading). For latency-sensitive workloads this composite reaction time — not the theoretical scaling logic — is usually the actual SLO risk, and it's the number to load-test explicitly rather than assume.
5. Deep Technical Walkthrough
Reconciliation loop, step by step. On operator startup and on every ScaledObject create/update, the KEDA Operator's controller reconciles by: (1) validating the ScaledObject spec and resolving TriggerAuthentication references to actual credentials, (2) creating or updating a Kubernetes HorizontalPodAutoscaler object it owns, with the HPA's metrics field pointing at the KEDA Metrics Adapter as an external metric source and minReplicas/maxReplicas copied from the ScaledObject (with minReplicas floored at 1 in the HPA object itself, since HPA can't go below 1 — the 0-1 transition is KEDA's own direct responsibility, not HPA's), and (3) starting a polling goroutine that, on pollingInterval, calls each configured scaler's GetMetrics (and, for scale-to-zero decisions, IsActive) methods.
The scale-from-zero handshake. When all triggers report inactive and current replicas are already 0, KEDA does nothing but keep polling — this is the idle steady state. The moment a poll finds a trigger active (non-empty queue, cron window open, external scaler reports a positive metric), KEDA's operator directly issues a scale command against the target resource's /scale subresource, setting replicas to 1 (bypassing the HPA object entirely for this specific 0→1 transition, since the HPA controller itself has already decided "this is below my floor, not my problem"). Once the target has ≥1 replica, subsequent scaling decisions flow through the normal path: the HPA controller (part of kube-controller-manager, running its own independent reconciliation loop on its own interval, typically 15s) queries the external metrics API — which the KEDA Metrics Adapter serves by querying the same scalers KEDA's operator polls — and computes desired replicas using the standard HPA algorithm (desiredReplicas = ceil(currentReplicas * currentMetricValue / desiredMetricValue)), same as it would for a CPU-based HPA.
Request flow for a Kafka-lag-driven ScaledObject. The Kafka scaler's GetMetrics call queries the target topic/consumer-group's committed offset versus the topic's latest offset (lag), normalizing it against the lagThreshold configured in the trigger (e.g., "scale so that each replica is responsible for roughly 1,000 messages of lag"). This value is exposed through the external metrics API as something like s0-kafka-orders-pending. The HPA controller reads that value, compares it against the target (implicitly 1, since KEDA normalizes the metric to already represent "how many replicas' worth of lag exists"), and scales the Deployment accordingly, subject to the HPA's own scale-up/scale-down stabilization windows (behavior.scaleUp.stabilizationWindowSeconds / scaleDown...), which KEDA's ScaledObject.spec.advanced.horizontalPodAutoscalerConfig.behavior field can override per-workload — critical for preventing scale-down thrash on a bursty queue where lag oscillates near the threshold.
Inference/GPU scaling — the external scaler's internals. The GPU external scaler (a gRPC service implementing KEDA's externalscaler.proto) receives GetMetrics calls from the KEDA operator and, internally, queries Prometheus for the target InferencePool's (or plain Deployment's) aggregate request-queue depth (vllm:num_requests_waiting summed across current replicas) and/or per-node GPU telemetry from the DCGM exporter (SM occupancy, memory-bandwidth utilization, VRAM allocation). It normalizes this into a "replicas needed" signal — commonly ceil(current_queue_depth / target_queue_depth_per_replica) — and returns it as the external metric value. Because this flows through the exact same HPA composition path as the Kafka example, all of KEDA's cooldown/stabilization/scale-to-zero machinery applies unmodified; the only genuinely new code is the metric-source translation.
Failure scenarios and recovery. Trigger source unreachable (Kafka broker down, Prometheus query timeout): KEDA's scaler returns an error on that polling cycle; KEDA's default behavior is to hold the last-known HPA state rather than scale blindly on missing data, and repeated failures surface as KEDA_METRICS_SERVER error-rate metrics and operator log entries — a platform team needs alerting on scaler health itself, not just on scaling behavior, because a silently-failing scaler means the workload is stuck at whatever replica count it happened to be at when the trigger source went dark. HPA controller and KEDA operator disagreeing transiently (e.g., during a KEDA operator restart mid-reconciliation): the owned HPA object is a standard Kubernetes resource that persists independently, so a KEDA operator restart doesn't cause an immediate scale event — the existing HPA keeps operating off its last-read metric value until KEDA resumes polling and refreshing it. Scale-to-zero followed immediately by a burst (classic "just went idle, immediately need 20 replicas"): bounded by pollingInterval for detection plus cold-start time for the 0→1 transition plus however long the subsequent HPA-driven ramp from 1→20 takes under its stabilization window — this compound latency is the single most common surprise in production and the reason minReplicas: 0 needs a deliberate case-by-case decision, not a blanket default.
6. Production Troubleshooting
Symptom: order-consumer Deployment stuck at 3 replicas despite Kafka consumer lag over 200,000 messages.
Investigation path a senior platform engineer would follow:
- Confirm the HPA KEDA owns is actually seeing the metric.
kubectl get hpa keda-hpa-order-consumer -o yaml— checkstatus.currentMetricsfor the external metric value KEDA is reporting. If it shows<unknown>or a stale value, the problem is upstream in KEDA's metrics adapter or the scaler itself, not the HPA algorithm. - Check the KEDA Metrics Adapter's own health.
kubectl logs -n keda deploy/keda-operator-metrics-apiserver --tail=100— look for errors querying the Kafka broker (auth failures, network policy blocking the connection, TLS cert issues) or timeouts. ATriggerAuthenticationreferencing a rotated-but-not-updated Secret is a frequent culprit — the scaler silently fails auth and the metric never updates. - Check the
ScaledObjectstatus conditions.kubectl describe scaledobject order-consumer-scaler— KEDA surfaces trigger-level health here (Active,Fallback, error conditions). AFallbackcondition firing means KEDA has switched to a configured fallback replica count because the trigger has been failing past the configured failure threshold — this explains "stuck at a fixed number" precisely, and the fix is resolving the underlying trigger connectivity, not touching theDeploymentdirectly. - Verify polling interval versus incident timeline. If
pollingIntervalis set to something like 300s for this trigger (inherited from a template meant for a low-priority workload), a 200,000-message lag spike over 10 minutes might only have been sampled once or twice — confirm the configured interval matches the workload's actual latency sensitivity. - Check for a
maxReplicaCountceiling silently capping growth.kubectl get scaledobject order-consumer-scaler -o jsonpath='{.spec.maxReplicaCount}'— amaxReplicaCountset conservatively months ago (before traffic grew) is a common, boring, and easy-to-miss cause of "why isn't this scaling further," distinct from any actual malfunction. - Confirm nodes exist to run the desired replica count. If HPA's
desiredReplicasis correct butreadyReplicaslags behind, the bottleneck has moved from KEDA/HPA to the cluster-autoscaler/Karpenter layer — check forPendingpods andFailedSchedulingevents referencing insufficient capacity, which is a completely different remediation path (node provisioning, not scaler configuration).
Sample debugging commands:
# Check what metric value KEDA is currently reporting to the HPA
kubectl get hpa keda-hpa-order-consumer -o jsonpath='{.status.currentMetrics}' | jq

# ScaledObject status conditions (Active / Fallback / error state)
kubectl describe scaledobject order-consumer-scaler -n orders

# KEDA operator logs filtered to a specific ScaledObject's reconciliation
kubectl logs -n keda deploy/keda-operator --since=15m | grep order-consumer-scaler

# Query the external metrics API directly, bypassing HPA, to isolate KEDA vs HPA
kubectl get --raw "/apis/external.metrics.k8s.io/v1beta1/namespaces/orders/s0-kafka-orders-pending" | jq

# Check for unschedulable pods blocking scale-out at the node layer
kubectl get pods -n orders --field-selector=status.phase=Pending
kubectl get events -n orders --field-selector reason=FailedScheduling --sort-by='.lastTimestamp'
7. Hands-on Lab
A local reproduction using kind, KEDA, and a RabbitMQ-backed consumer — no cloud account or GPU required to exercise the full scale-out/scale-to-zero mechanics.
# 1. Create a kind cluster
kind create cluster --name keda-lab

# 2. Install KEDA via Helm
helm repo add kedacore https://kedacore.github.io/charts
helm repo update
helm install keda kedacore/keda --namespace keda --create-namespace

# 3. Deploy RabbitMQ (single-node, lab only) and a consumer Deployment
kubectl create namespace demo
helm repo add bitnami https://charts.bitnami.com/bitnami
helm install rabbitmq bitnami/rabbitmq -n demo \
  --set auth.username=lab --set auth.password=labpass

kubectl apply -n demo -f - <<'EOF'
apiVersion: apps/v1
kind: Deployment
metadata:
  name: order-consumer
spec:
  replicas: 0
  selector:
    matchLabels: {app: order-consumer}
  template:
    metadata:
      labels: {app: order-consumer}
    spec:
      containers:
      - name: consumer
        image: pyrabbitmq/consumer-demo:latest
        env:
        - name: RABBITMQ_HOST
          value: rabbitmq.demo.svc.cluster.local
EOF

# 4. Define TriggerAuthentication referencing the RabbitMQ credentials
kubectl apply -n demo -f - <<'EOF'
apiVersion: keda.sh/v1alpha1
kind: TriggerAuthentication
metadata:
  name: rabbitmq-trigger-auth
spec:
  secretTargetRef:
  - parameter: host
    name: rabbitmq-default-user
    key: connection-string
EOF

# 5. Define the ScaledObject: scale-to-zero, queue-length driven
kubectl apply -n demo -f - <<'EOF'
apiVersion: keda.sh/v1alpha1
kind: ScaledObject
metadata:
  name: order-consumer-scaler
spec:
  scaleTargetRef:
    name: order-consumer
  pollingInterval: 10
  cooldownPeriod: 60
  minReplicaCount: 0
  maxReplicaCount: 15
  triggers:
  - type: rabbitmq
    metadata:
      queueName: orders.pending
      mode: QueueLength
      value: "20"
    authenticationRef:
      name: rabbitmq-trigger-auth
EOF

# 6. Confirm scale-to-zero: no messages, deployment should sit at 0 replicas
kubectl get deployment order-consumer -n demo -w

# 7. Publish a burst of messages and watch scale-out happen
kubectl run rabbitmq-publish --rm -it --restart=Never --image=pika-publisher:latest \
  -n demo -- python publish.py --queue orders.pending --count 500

# 8. Observe the ScaledObject and HPA reacting
kubectl get scaledobject order-consumer-scaler -n demo
kubectl get hpa keda-hpa-order-consumer -n demo -w

# Validation: replica count should track queue length / 20 (the target value),
# capped at maxReplicaCount, then return to 0 after cooldownPeriod once drained.

# Cleanup
kind delete cluster --name keda-lab
For the GPU/inference half of the lab (conceptual, since it needs real GPU nodes): deploy the ScaledObject with an external trigger type pointing at a small gRPC scaler stub that returns a hardcoded, then variable, "queue depth" value, and confirm the same scale-out/cooldown/scale-to-zero behavior applies identically — this is the fastest way to prove that GPU-aware scaling is "just another trigger" from KEDA's perspective, not special-cased machinery.
8. Production Case Study
KEDA's origin story is itself the case study for why this layer needed to exist as shared infrastructure rather than being reinvented per company: Microsoft and Red Hat co-created it specifically to solve Azure Functions' need for event-driven scaling on Kubernetes, then donated it to CNCF (Sandbox in 2020, Graduated August 2023) precisely because every platform team running event-driven workloads on Kubernetes was independently building some version of "watch a queue, patch a replica count" — the same duplication-avoidance logic that has driven every other successful CNCF standardization (CNI, CSI, the Gateway API Inference Extension covered in an earlier session).
On the GPU/inference side, the 2026 pattern that's converged across cloud providers and the CNCF community is architecturally identical across implementations even though the specific telemetry differs: Azure's AKS engineering team published a reference pattern for autoscaling KAITO-deployed inference workloads with KEDA driving replica count from request-queue and GPU metrics rather than CPU; independent community work (documented in CNCF's own blog through 2026) built external gRPC scalers pulling NVIDIA DCGM metrics directly, explicitly motivated by the same "GPU utilization percentage is a bad proxy" problem this session opened with. The consistent design across all of these: keep KEDA's core scale-to-zero/cooldown/HPA-composition machinery untouched, and treat GPU-awareness purely as a new trigger source feeding the same pipeline — nobody building this at scale in 2026 chose to fork KEDA's scaling logic itself for GPU workloads, which is a strong signal the layered architecture in Section 3 is the right shape rather than a coincidence.
The consistent lesson from these production deployments: the financial case for event-driven GPU autoscaling is usually the single fastest-to-justify FinOps win a platform team can ship, because idle accelerator cost is large, visible on a monthly invoice, and trivially attributable to a specific workload — unlike a lot of infrastructure investment where ROI is diffuse, "we cut this GPU pool's idle-hours cost in half" is a number a platform team can put directly in a slide.
9. Architecture Review
Strengths. Composing with HPA rather than replacing it means KEDA inherits a decade of hardening in the core scaling algorithm, stabilization windows, and behavior tuning for free, and it means workloads can be migrated to/from KEDA without touching anything downstream that already understands standard HPA objects (dashboards, alerting on HPA events, existing runbooks). The scaler abstraction (70+ built-ins plus the external-scaler gRPC protocol) means new event sources — including something as different from a message queue as GPU telemetry — slot into the same operational model without new mental overhead for the team running it.
Weaknesses. The polling model is fundamentally not real-time — reaction time is bounded by pollingInterval, and tightening it cluster-wide to improve reaction speed increases load against every trigger source (Kafka brokers, cloud provider metrics APIs with their own rate limits, Prometheus), so there's a real tension between responsiveness and trigger-source load that has to be tuned per workload rather than solved globally. Scale-to-zero cold-start latency is invisible in the architecture diagram but very visible to the first user hitting a just-woken service — for GPU inference workloads specifically, model-weight load time can be tens of seconds to minutes for large models, which is often unacceptable for latency-sensitive first-request SLOs and forces a warm-buffer compromise that partially defeats the cost-saving purpose of scaling to zero in the first place.
What breaks first at 10x scale. Trigger-source query load — at 10x the ScaledObject count, the aggregate polling load against a shared Kafka cluster, shared Prometheus, or a rate-limited cloud metrics API (CloudWatch's GetMetricData throttling is a real production constraint teams hit) becomes the bottleneck before KEDA's own operator does; this needs either sharding trigger polling across multiple KEDA operator instances (KEDA supports this), batching/caching at the metrics-source layer, or consolidating many low-priority ScaledObjects onto longer polling intervals to reduce aggregate query volume.
What changes at 100M-user scale. Multi-region becomes unavoidable, and each region needs its own KEDA deployment scaling against region-local event sources (a Kafka topic's lag in one region shouldn't drive scaling decisions for pods in another) — this is a straightforward extension of the pattern (KEDA has no inherent global-state assumption) but requires deliberate per-region ScaledObject templating rather than one global config. GPU capacity planning shifts from "scale a fixed pool" to "scale across a portfolio of GPU SKUs/regions with cost-aware preference ordering," which pushes complexity into the external scaler's decision logic (which replica type to prefer) more than into KEDA itself.
What to redesign. Cold-start latency for scale-from-zero on GPU/inference workloads is the piece most worth redesigning proactively rather than discovering under load — a warm-pool floor (minReplicaCount: 1 instead of 0 for latency-critical inference services, accepting some idle cost as an explicit SLO trade) is usually the right call for anything user-facing, reserving true scale-to-zero for genuinely bursty, latency-tolerant workloads like the batch reconciliation job. Trigger-source query load should be modeled and capacity-planned the same way any other production dependency is, rather than discovered when a Kafka cluster starts throttling KEDA's polling traffic during an incident.
10. Best Practices
Scale on the signal that actually reflects backlog or capacity for the workload — queue depth/lag for consumers, request-queue depth or cache occupancy for inference servers, a cron schedule for batch jobs — and treat CPU-based scaling as the fallback for workloads that are genuinely CPU-bound, not the default for everything. Set minReplicaCount: 0 deliberately per workload based on its latency tolerance for cold starts, never as a blanket cluster-wide default; latency-critical services almost always want a warm floor of 1+. Tune pollingInterval and HPA behavior stabilization windows per workload class rather than leaving every ScaledObject on the same default — a low-priority batch trigger and a latency-sensitive inference trigger have very different responsiveness requirements. Scope TriggerAuthentication credentials per trigger rather than granting the KEDA operator's service account broad standing access to every metrics backend in the environment. Alert on scaler health itself (trigger query failures, Fallback conditions) as a distinct signal from scaling behavior — a silently-failing trigger looks identical to "traffic is just low" until lag has been quietly climbing for an hour. Pair every ScaledObject with a maxReplicaCount that's revisited on a schedule (quarterly capacity review, not "set once at launch") since traffic growth silently caps out against a stale ceiling far more often than it triggers actual runaway scaling. For GPU/inference workloads, load-test the full cold-start path (image pull, container start, model load) explicitly and bake that number into the SLO conversation before enabling scale-to-zero, not after an incident reveals it.
11. Common Production Mistakes
Leaving every ScaledObject on the default 30s pollingInterval and 300s cooldownPeriod regardless of workload shape, producing either unnecessarily aggressive trigger-source query load for low-priority workloads or sluggish reaction for latency-sensitive ones. Enabling minReplicaCount: 0 on a user-facing service without load-testing cold-start latency first, then discovering the first-request-after-idle penalty during a real traffic spike rather than in a lab. Treating KEDA and Karpenter/cluster-autoscaler as redundant rather than complementary — teams sometimes assume KEDA alone handles "autoscaling" end to end and are surprised when pods scale in the ScaledObject/HPA sense but sit Pending because no node-level autoscaler is provisioning capacity for them. Granting the KEDA operator a single broadly-privileged credential for all trigger sources instead of per-TriggerAuthentication scoping, turning a KEDA compromise into a blast radius across every queue and metrics system it's configured against. Scaling GPU inference replicas on raw GPU-utilization percentage because it's the metric that was easiest to wire up, then being confused when the pool is "scaled correctly" by that metric while p99 latency SLOs are still breached — the metric that's easy to get isn't always the metric that correlates with capacity. Never revisiting maxReplicaCount after initial launch, so a workload silently plateaus at a stale ceiling during genuine growth and the on-call engineer's first instinct is to suspect a scaling bug rather than check the configured cap.
12. Interview Preparation
Q: How does KEDA relate to the standard Kubernetes HPA — does it replace it? A: No. KEDA implements the Kubernetes external metrics API and, for any Deployment/StatefulSet target, creates and owns a standard HorizontalPodAutoscaler object pointed at that external metric. The HPA controller inside kube-controller-manager does the actual scale-out math using its normal algorithm and stabilization windows — KEDA's job is purely translating event-source state (queue depth, lag, a cron schedule, GPU telemetry) into a metric HPA can consume. The one thing KEDA does outside HPA's control is the 0↔1 replica transition, since HPA structurally enforces a minimum of 1 replica and can't scale to zero on its own.
Q: Why is CPU utilization often a poor autoscaling signal, and give a concrete example. A: CPU correlates with compute-bound work, but many production workloads are I/O-bound or backlog-bound — a Kafka consumer waiting on a slow downstream network call can sit at low CPU while consumer lag climbs into the hundreds of thousands, because the bottleneck is per-message latency, not compute. Scaling on CPU in that case never triggers, while the actual business-relevant signal (lag, meaning "how far behind are we") keeps growing unaddressed. The fix is scaling directly on the metric that represents backlog or capacity — queue depth/lag for consumers, request-queue occupancy for inference servers — rather than a proxy that happens to be easy to measure.
Q: Walk through what happens when a ScaledObject with minReplicaCount: 0 receives its first event after being idle. A: KEDA's polling loop detects the trigger going active (non-empty queue, cron window opening, external scaler reporting demand) on its next pollingInterval. Because current replicas are 0, KEDA bypasses the owned HPA object (which can't act below its floor of 1) and directly patches the target's replica count to 1. Once at least 1 replica exists, the HPA controller resumes normal operation, reading the external metric via the KEDA Metrics Adapter and scaling further as needed using the standard HPA algorithm. Total reaction time is bounded by polling interval plus pod cold-start time (image pull/start, plus model-load time for GPU inference workloads) — this composite latency is the number to test explicitly before enabling scale-to-zero on anything latency-sensitive.
Q: How would you autoscale a GPU-backed LLM inference service, and why not just use HPA on GPU utilization percentage? A: Use KEDA with a custom external scaler that queries the model server's own metrics (vLLM-style request-queue depth, KV-cache occupancy) or NVIDIA DCGM telemetry, normalizes it to a "replicas needed" value, and feeds it through KEDA's standard trigger pipeline into the HPA it manages — reusing all of KEDA's existing cooldown/stabilization/scale-to-zero machinery rather than building a bespoke controller. Raw GPU-utilization percentage is rejected as the primary signal because it doesn't reliably correlate with remaining serving capacity — a GPU can show moderate utilization while memory-bandwidth- or KV-cache-saturated, meaning the pool looks "fine" by that metric while requests are actually queuing and latency SLOs are breaching.
Q: What's the biggest operational risk in a KEDA-heavy autoscaling architecture, and how do you mitigate it? A: Silent trigger-source failure that looks identical to "traffic is genuinely low" — if a scaler's query to Kafka/Prometheus/a cloud metrics API starts failing (auth expiry, network policy change, rate limiting) and there's no alerting on scaler health specifically, the workload sits at whatever replica count it happened to have when the trigger went dark, potentially for hours, with nothing paging anyone because "the deployment is running fine, just at a fixed size" doesn't trip a typical health-check alert. Mitigation is explicit alerting on ScaledObject status conditions (Fallback, error states) and KEDA operator/metrics-adapter error rates as first-class signals, independent from and in addition to standard workload health monitoring.
13. Latest Industry Updates
KEDA has been a CNCF Graduated project since August 2023, and through 2026 the most significant ecosystem development has been the maturation of GPU-aware external scalers as a recognized, documented pattern rather than a bespoke one-off — CNCF's own blog published a walkthrough of building a GPU-autoscaling external scaler for KEDA in May 2026, explicitly framing it as the natural extension of KEDA's existing trigger model to NVIDIA DCGM-sourced telemetry (CNCF: GPU autoscaling on Kubernetes with KEDA). This matters for production teams because it means the GPU-scaling pattern described in this session is no longer a from-scratch build — reference implementations and community scalers (including gRPC-based external scalers exposing native NVML metrics without requiring a full Prometheus stack) are available to adopt or fork rather than design from first principles.
Cloud-managed Kubernetes offerings have shipped first-party documentation packaging this same pattern: Microsoft's AKS engineering blog published a reference architecture for autoscaling KAITO-deployed inference workloads using KEDA driven by request-queue and GPU metrics, aimed specifically at teams running self-hosted model inference on AKS who want to avoid the fixed-pool idle-cost problem covered in Section 2 (AKS Engineering Blog: Autoscale KAITO inference workloads with KEDA). The broader signal across cloud providers converging on the same "KEDA plus a GPU-telemetry external scaler" shape — rather than each proposing a competing GPU-autoscaling primitive — mirrors the same standardization dynamic seen with the Gateway API Inference Extension for inference-aware routing: the ecosystem is choosing to extend existing, portable Kubernetes primitives rather than fragment into vendor-specific autoscaling engines.
On the bare-metal/on-prem side, community work through 2026 has explored pairing KEDA with the Kubernetes Descheduler for two-tier autoscaling in environments without a cloud-native cluster autoscaler to provision nodes on demand — using KEDA for pod-level scale-to-zero and the Descheduler to actively rebalance and consolidate nodes as workloads scale down, since bare-metal clusters can't simply provision fresh nodes the way Karpenter does on AWS (KEDA and Descheduler: Two-Tier Autoscaling on Bare Metal). This is a useful pattern for platform teams operating outside the major clouds, where the KEDA-plus-Karpenter composition from Section 3 isn't directly available and node-level elasticity has to be approximated differently.
Sources:
- CNCF Blog — GPU autoscaling on Kubernetes with KEDA: Building an external scaler
- AKS Engineering Blog — Autoscale KAITO inference workloads on AKS using KEDA
- KEDA and Descheduler: Two-Tier Autoscaling on Bare Metal
- KEDA Scalers documentation
- KEDA Concepts — Scaling Deployments, StatefulSets & Custom Resources
- kedacore/keda — GitHub Releases
- pmady/keda-gpu-scaler — External gRPC Scaler for GPU workloads via native NVML metrics
14. Summary & Cheat Sheet
Core architecture: KEDA operator + metrics adapter implement the Kubernetes external metrics API and own a standard HorizontalPodAutoscaler per ScaledObject — HPA does the scale-out math, KEDA owns metric translation and the 0↔1 transition HPA structurally can't perform. ScaledJob handles batch-shaped workloads via per-unit Job creation instead of Deployment replica scaling. Node-level provisioning is a separate concern, composed with Karpenter/cluster-autoscaler.
Key CRDs/components: ScaledObject (Deployment/StatefulSet scaling), ScaledJob (batch/Job scaling), TriggerAuthentication/ClusterTriggerAuthentication (per-trigger scoped credentials), scalers (70+ built-in, plus the ExternalScaler gRPC protocol for custom sources like GPU telemetry).
Scale-to-zero mechanics: KEDA directly patches replica count for the 0→1 and 1→0 transitions (bypassing HPA's floor-of-1 constraint); HPA takes over for everything above 1 replica. cooldownPeriod prevents flapping on bursty-but-not-idle triggers.
GPU/inference scaling: don't scale on raw GPU-utilization percentage — build or adopt an external scaler pulling request-queue depth, KV-cache occupancy, or NVIDIA DCGM telemetry, and feed it through the same ScaledObject/HPA pipeline as any other trigger.
Troubleshooting checklist: confirm the owned HPA is actually receiving a fresh external metric value → check KEDA metrics-adapter logs for trigger-source auth/connectivity failures → check ScaledObject status conditions for Fallback/error states → verify pollingInterval matches the workload's latency sensitivity → check maxReplicaCount for a stale ceiling → confirm node-level capacity exists (Karpenter/cluster-autoscaler layer) if desired replicas aren't becoming ready replicas.
Best practice one-liners: scale on the real backlog/capacity signal, not a CPU proxy. minReplicaCount: 0 is a deliberate per-workload decision, not a default. Scope trigger credentials per-TriggerAuthentication, never one broad service account. Alert on scaler health as a distinct signal from scaling behavior. Revisit maxReplicaCount on a schedule, not once at launch. Load-test the full cold-start path before shipping scale-to-zero on anything latency-sensitive.
Failure points to watch as you scale: aggregate trigger-source polling load (Kafka/Prometheus/cloud metrics API rate limits) becomes the bottleneck before KEDA itself does — shard operators or lengthen polling intervals for low-priority triggers before it does. Cold-start latency on scale-from-zero is the most common production surprise on GPU/inference workloads — budget for a warm floor on anything latency-critical rather than discovering the penalty during a real spike.